888 BOT #alerts█ 888 BOT #alerts (open source)
This is an Expert Advisor 'EA' or Automated trading script for ‘longs’ and ‘shorts’, which uses only a Take Profit or, in the worst case, a Stop Loss to close the trade.
It's a much improved version of the previous ‘Repanocha’. It doesn`t use 'Trailing Stop' or 'security ()' functions (although using a security function doesn`t mean that the script repaints) and all signals are confirmed, therefore the script doesn`t repaint in alert mode and is accurate in backtest mode.
Apart from the previous indicators, some more and other functions have been added for Stop-Loss, re-entry and leverage.
It uses 8 indicators, (many of you already know what they are, but in case there is someone new), these are the following:
1. Jurik Moving Average
It's a moving average created by Mark Jurik for professionals which eliminates the 'lag' or delay of the signal. It's better than other moving averages like EMA , DEMA , AMA or T3.
There are two ways to decrease noise using JMA . Increasing the 'LENGTH' parameter will cause JMA to move more slowly and therefore reduce noise at the expense of adding 'lag'
The 'JMA LENGTH', 'PHASE' and 'POWER' parameters offer a way to select the optimal balance between 'lag' and over boost.
Green: Bullish , Red: Bearish .
2. Range filter
Created by Donovan Wall, its function is to filter or eliminate noise and to better determine the price trend in the short term.
First, a uniform average price range 'SAMPLING PERIOD' is calculated for the filter base and multiplied by a specific quantity 'RANGE MULTIPLIER'.
The filter is then calculated by adjusting price movements that do not exceed the specified range.
Finally, the target ranges are plotted to show the prices that will trigger the filter movement.
Green: Bullish , Red: Bearish .
3. Average Directional Index ( ADX Classic) and ( ADX Masanakamura)
It's an indicator designed by Welles Wilder to measure the strength and direction of the market trend. The price movement is strong when the ADX has a positive slope and is above a certain minimum level 'ADX THRESHOLD' and for a given period 'ADX LENGTH'.
The green color of the bars indicates that the trend is bullish and that the ADX is above the level established by the threshold.
The red color of the bars indicates that the trend is down and that the ADX is above the threshold level.
The orange color of the bars indicates that the price is not strong and will surely lateralize.
You can choose between the classic option and the one created by a certain 'Masanakamura'. The main difference between the two is that in the first it uses RMA () and in the second SMA () in its calculation.
4. Parabolic SAR
This indicator, also created by Welles Wilder, places points that help define a trend. The Parabolic SAR can follow the price above or below, the peculiarity that it offers is that when the price touches the indicator, it jumps to the other side of the price (if the Parabolic SAR was below the price it jumps up and vice versa) to a distance predetermined by the indicator. At this time the indicator continues to follow the price, reducing the distance with each candle until it is finally touched again by the price and the process starts again. This procedure explains the name of the indicator: the Parabolic SAR follows the price generating a characteristic parabolic shape, when the price touches it, stops and turns ( SAR is the acronym for 'stop and reverse'), giving rise to a new cycle. When the points are below the price, the trend is up, while the points above the price indicate a downward trend.
5. RSI with Volume
This indicator was created by LazyBear from the popular RSI .
The RSI is an oscillator-type indicator used in technical analysis and also created by Welles Wilder that shows the strength of the price by comparing individual movements up or down in successive closing prices.
LazyBear added a volume parameter that makes it more accurate to the market movement.
A good way to use RSI is by considering the 50 'RSI CENTER LINE' centerline. When the oscillator is above, the trend is bullish and when it is below, the trend is bearish .
6. Moving Average Convergence Divergence ( MACD ) and ( MAC-Z )
It was created by Gerald Appel. Subsequently, the histogram was added to anticipate the crossing of MA. Broadly speaking, we can say that the MACD is an oscillator consisting of two moving averages that rotate around the zero line. The MACD line is the difference between a short moving average 'MACD FAST MA LENGTH' and a long moving average 'MACD SLOW MA LENGTH'. It's an indicator that allows us to have a reference on the trend of the asset on which it is operating, thus generating market entry and exit signals.
We can talk about a bull market when the MACD histogram is above the zero line, along with the signal line, while we are talking about a bear market when the MACD histogram is below the zero line.
There is the option of using the MAC-Z indicator created by LazyBear, which according to its author is more effective, by using the parameter VWAP ( volume weighted average price ) 'Z-VWAP LENGTH' together with a standard deviation 'STDEV LENGTH' in its calculation.
7. Volume Condition
Volume indicates the number of participants in this war between bulls and bears, the more volume the more likely the price will move in favor of the trend. A low trading volume indicates a lower number of participants and interest in the instrument in question. Low volumes may reveal weakness behind a price movement.
With this condition, those signals whose volume is less than the volume SMA for a period 'SMA VOLUME LENGTH' multiplied by a factor 'VOLUME FACTOR' are filtered. In addition, it determines the leverage used, the more volume , the more participants, the more probability that the price will move in our favor, that is, we can use more leverage. The leverage in this script is determined by how many times the volume is above the SMA line.
The maximum leverage is 8.
8. Bollinger Bands
This indicator was created by John Bollinger and consists of three bands that are drawn superimposed on the price evolution graph.
The central band is a moving average, normally a simple moving average calculated with 20 periods is used. ('BB LENGTH' Number of periods of the moving average)
The upper band is calculated by adding the value of the simple moving average X times the standard deviation of the moving average. ('BB MULTIPLIER' Number of times the standard deviation of the moving average)
The lower band is calculated by subtracting the simple moving average X times the standard deviation of the moving average.
the band between the upper and lower bands contains, statistically, almost 90% of the possible price variations, which means that any movement of the price outside the bands has special relevance.
In practical terms, Bollinger bands behave as if they were an elastic band so that, if the price touches them, it has a high probability of bouncing.
Sometimes, after the entry order is filled, the price is returned to the opposite side. If price touch the Bollinger band in the same previous conditions, another order is filled in the same direction of the position to improve the average entry price, (% MINIMUM BETTER PRICE ': Minimum price for the re-entry to be executed and that is better than the price of the previous position in a given %) in this way we give the trade a chance that the Take Profit is executed before. The downside is that the position is doubled in size. 'ACTIVATE DIVIDE TP': Divide the size of the TP in half. More probability of the trade closing but less profit.
█ STOP LOSS and RISK MANAGEMENT.
A good risk management is what can make your equity go up or be liquidated.
The % risk is the percentage of our capital that we are willing to lose by operation. This is recommended to be between 1-5%.
% Risk: (% Stop Loss x % Equity per trade x Leverage) / 100
First the strategy is calculated with Stop Loss, then the risk per operation is determined and from there, the amount per operation is calculated and not vice versa.
In this script you can use a normal Stop Loss or one according to the ATR. Also activate the option to trigger it earlier if the risk percentage is reached. '% RISK ALLOWED' wich is calculated according with: '%EQUITY ON EACH ENTRY'. Only works with Stop Loss on 'NORMAL' or 'BOTH' mode.
'STOP LOSS CONFIRMED': The Stop Loss is only activated if the closing of the previous bar is in the loss limit condition. It's useful to prevent the SL from triggering when they do a ‘pump’ to sweep Stops and then return the price to the previous state.
█ ALERTS
There is an alert for each leverage, therefore a maximum of 8 alerts can be set for 'long' and 8 for 'short', plus an alert to close the trade with Take Profit or Stop Loss in market mode. You can also place Take Profit limit and Stop Loss limit orders a few seconds after filling the position entry order.
- 'MAXIMUM LEVERAGE': It is the maximum allowed multiplier of the % quantity entered on each entry for 1X according to the volume condition.
- 'ADVANCE ALERTS': There is always a time delay from when the alert is triggered until it reaches the exchange and can be between 1-15 seconds. With this parameter, you can advance the alert by the necessary seconds to activate it earlier. In this way it can be synchronized with the exchange so that the execution time of the entry order to the position coincides with the opening of the bar.
The settings are for Bitcoin at Binance Futures (BTC: USDTPERP) in 15 minutes.
For other pairs and other timeframes, the settings have to be adjusted again. And within a month, the settings will be different because we all know the market and the trend are changing.
Cerca negli script per "take profit"

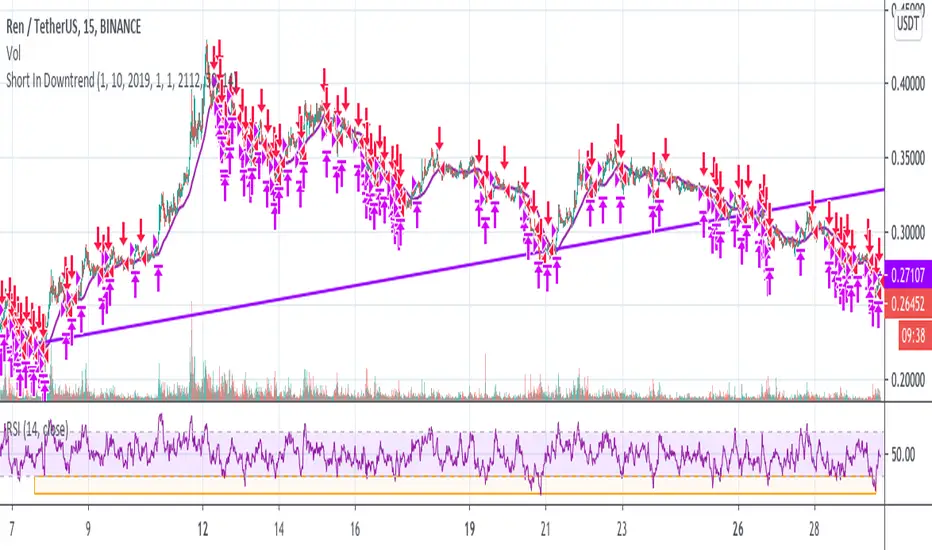
Short In Downtrend Below MA100 (Coinrule)This is a simple strategy to take advantage of downtrends. It's useful to run such a strategy as a hedge in times of market uncertainty.
The Sell Condition - Entry
The sell signal triggers when:
the coin has MA (100) greater than the price in a timeframe of 15 minutes, meaning that the coin is in a short-term downtrend.
the coin has an RSI greater than 30 in a timeframe of 15 minutes, indicating that it didn't reach oversold conditions yet, so there is still room for a further price drop.
On Coinrule, you can launch the strategy on real market conditions, setting up multiple sequential sell orders. The strategy would keep selling while the price stays below the MA(100). In that case, it's advisable to set low amounts for the sell orders. the position will grow gradually while the downtrend intensifies. Set a minimum time interval between the sell orders will also help to have control over the overall position size.
The Buy Condition - Exit
The bot connects to each trade a stop loss and a take profit. The percentages are optimized for short term trades on mid-cap coins. You can adjust the percentages depending on the specific coin you are trading. A ratio of 1:1.5 between the stop loss and the take profit could work as the strategy trades in the same direction of the trend.
Stop loss at 3% from the entry price
Take profit at 2% from the entry price
A slightly larger stop loss allows tolerating more volatility to reduce the case of stops triggering when it shouldn't.
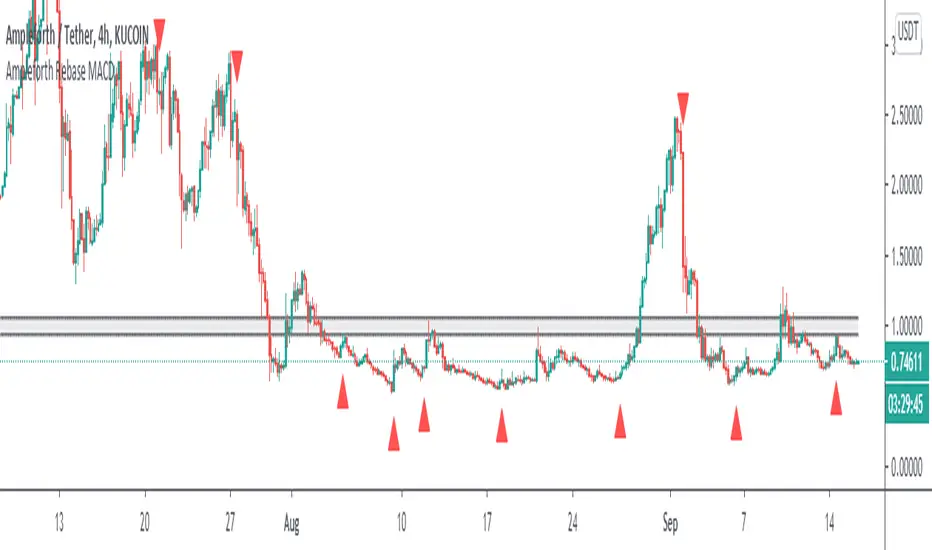
Ampleforth Rebase MACDThis script reveals Ampleforth rebase levels which are going to always work. In addition to that is MACD crossovers serving as potential buy/sell entries. You can set alerts for MACD crossovers and price entering balanced value area (0.96 - 1.06).
MACD signals can be used to automatically open a position and entering a balanced value area can be used as take-profit. Since the price will always move to this level, using this strategy without leverage should be profitable.
Ampleforth seems like a nice asset to trade since it is unlikely to correlate with anything else. At least not when it gets to the extreme levels.
MACD+ Strategy [SystemAlpha]This is a strategy based on MACD Oscillator . Instead of using just the normal crossovers, we use trend filters, trailing stop loss and take profit targets. This strategy was developed for crypto, forex and stocks on daily timeframe but feel free to experiment on 15 minutes or higher using heikin ashi or normal candles
In this strategy you have a choice of:
Trend Filters:
- Average Directional Index ( ADX ) – buy when price is trend is up and sell when trend is down.
- Moving Average (MA) – buy when price close above the defined moving average and sell when price close below moving average
- Parabolic SAR – buy when SAR is above price is above price and sell when SAR is below price.
- All - Use ADX , MA and SAR as filters
For MA Filter , you can use the “TF MA Type” and "TF MA Period" parameter to select Simple or Exponential Moving Average and length.
Stop Loss:
- Average True Range (ATR) – ATR % stop as trailing stop loss.
- Parabolic SAR ( SAR ) – Parabolic SAR adapted as trailing stop loss.
For ATR , you can use the “ATR Trailing Stop Multiplier” parameter to set an initial offset for trailing stop loss.
Take Profit Target:
- Average True Range (ATR) – ATR % stop as trailing stop loss.
- Standard % – Percent as target profit
For ATR , you can use the “ATR Take Profit Multiplier” parameter to set an initial offset for trailing stop loss.
Additional feature include:
- Regular and Hidden Divergence display and alerts
STRATEGY ONLY:
- Set back test date range
- Set trade direction - Long, Short or Both
- Use timed exit - Select method and bars
- Method 1: Exit after specified number of bars.
- Method 2: Exit after specified number of bars, ONLY if position is currently profitable.
- Method 3: Exit after specified number of bars, ONLY if position is currently losing.
TradingView Links:
Alerts:
MACD:
How to use:
1. Apply the script by browsing through Indicators --> Invite-Only scripts and select the indicator
2. Once loaded, click the gear (settings) button to select/adjust the parameters based on your preference.
3. Wait for the next BUY or SELL signal to enter the trade!
Disclaimer:
The indicator and signals generated do not constitute investment advice; are provided solely for informational purposes and therefore is not an offer to buy or sell a security; are not warranted to be correct, complete or accurate; and are subject to change without notice.

Grid Like StrategyIt is possible to use progressive position sizing in order to recover from past losses, a well-known position sizing system being the "martingale", which consists of doubling your position size after a loss, this allows you to recover any previous losses in a losing streak + winning an extra. This system has seen a lot of attention from the trading community (mostly from beginners), and many strategies have been designed around the martingale, one of them being "grid trading strategies".
While such strategies often shows promising results on paper, they are often subjects to many frictions during live trading that makes them totally unusable and dangerous to the trader. The motivations behind posting such a strategy isn't to glorify such systems, but rather to present the problems behind them, many users come to me with their ideas and glorious ways to make money, sometimes they present strategies using the martingale, and it is important to present the flaws of this methodology rather than blindly saying "you shouldn't use it".
Strategy Settings
Point determines the "grid" size and should be adjusted accordingly to the scale of the symbol you are applying the strategy to. Higher value would require larger price movements in order to trigger a trade, as such higher values will generate fewer trades.
The order size determines the number of contracts/shares to purchase.
The martingale multiplier determines the factor by which the position size is multiplied after a loss, using values higher to 2 will "squarify" your balance, while a value of 1 would use a constant position sizing.
Finally, the anti-martingale parameter determines whether the strategy uses a reverse martingale or not, if set to true then the position size is multiplied after any wins.
The Grid
Grid strategies are commons and do not present huge problems until we use certain position sizing methods such as the martingale. A martingale is extremely sensitive to any kind of friction (frictional costs, slippage...etc), the grid strategy aims to provide a stable and simple environment where a martingale might possibly behave well.
The goal of a simple grid strategy is to go long once the price crossover a certain level, a take profit is set at the level above the current one and stop loss is placed at the level below the current one, in a winning scenario the price reach the take profit, the position is closed and a new one is opened with the same setup. In a losing scenario, the price reaches the stop loss level, the position is closed and a short one is opened, the take profit is set at the level below the current one, and a stop loss is set at the level above the current one. Note that all levels are equally spaced.
It follows from this strategy that wins and losses should be constant over time, as such our balance would evolve in a linear fashion. This is a great setup for a martingale, as we are theoretically assured to recover all the looses in a losing streak.
Martingale - Exponential Decays - Risk/Reward
By using a martingale we double our position size (exposure) each time we lose a trade, if we look at our balance when using a martingale we see significant drawdowns, with our balance peaking down significantly. The martingale sequence is subject to exponential growth, as such using a martingale makes our balance exposed to exponential decays, that's really bad, we could basically lose all the initially invested capital in a short amount of time, it follows from this that the theoretical success of a martingale is determined by what is the maximum losing streak you can endure
Now consider how a martingale affects our risk-reward ratio, assuming unity position sizing our martingale sequence can be described by 2^(x-1) , using this formula we would get the amount of shares/contracts we need to purchase at the x trade of a losing streak, we would need to purchase 256 contracts in order to recover from a losing streak of size 9, this is enormous when you take into account that your wins are way smaller, the risk-reward ratio is totally unfair.
Of course, some users might think that a losing streak of size 9 is pretty unlikely, if the probability of winning and losing are both equal to 0.5, then the probability of 9 consecutive losses is equal to 0.5^9 , there are approximately 0.2% of chance of having such large losing streak, note however that under a ranging market such case scenario could happen, but we will see later that the length of a losing streak is not the only problem.
Other Problems
Having a capital large enough to tank 9any number of consecutive losses is not the only thing one should focus on, as we have to take into account market prices and trading dynamics, that's where the ugly part start.
Our first problem is frictional costs, one example being the spread, but this is a common problem for any strategy, however here a martingale is extra sensitive to it, if the strategy does not account for it then we will still double our positions costs but we might not recover all the losses of a losing streak, instead we would be recovering only a proportion of it, under such scenario you would be certain to lose over time.
Another problem are gaps, market price might open under a stop-loss without triggering it, and this is a big no-no.
Equity of the strategy on AMD, in a desired scenario the equity at the second arrow should have been at a higher position than the equity at the first arrow.
In order for the strategy to be more effective, we would need to trade a market that does not close, such as the cryptocurrency market. Finally, we might be affected by slippage, altho only extreme values might drastically affect our balance.
The Anti Martingale
The strategy lets you use an anti-martingale, which double the position size after a win instead of a loss, the goal here is not to recover from a losing strike but instead to profit from a potential winning streak.
Here we are exposing your balance to exponential gross but you might also lose a trade at the end a winning streak, you will generally want to reinitialize your position size after a few wins instead of waiting for the end of a streak.
Alternative
You can use other-kind of progressions for position sizing, such as a linear one, increasing your position size by a constant number each time you lose. More gentle progressions will recover a proportion of your losses in a losing streak.
You can also simulate the effect of a martingale without doubling your position size by doubling your target profit, if for example you have a 10$ profit-target/stop-loss and lose a trade, you can use a 20$ profit target to recover from the lost trade + gain a profit of 10$. While this approach does not introduce exponential decay in your balance, you are betting on the market reaching your take profits, considering the fact that you are doubling their size you are expecting market volatility to increase drastically over time, as such this approach would not be extremely effective for high losing streak.
Conclusion
You will see a lot of auto-trading strategies that are based on a grid approach, they might even use a martingale. While the backtests will look appealing, you should think twice before using such kind of strategy, remember that frictional costs will be a huge challenge for the strategy, and that it assumes that the trader has an important initial capital. We have also seen that the risk/reward ratio is theoretically the worst you can have on a strategy, having a low reward and a high risk. This does not mean that progressive position sizing is bad, but it should not be pushed to the extreme.
It is nice to note that the martingale is originally a betting system designed for casino games, which unlike trading are not subject to frictional costs, but even casino players don't use it, so why would you?
Thx for reading

inwCoin Martingale Strategy ( for Bitcoin )** Same as my previous martingale script but this version = opensource **
inwCoin Martingale Strategy is the proof of concept strategy that in the end, anyone who using martingale strategy will kaboom their portfolio.
For those who don't know what is "martingale".. it's a simple double down strategy in the hope to cover the loss in previous entry.
Example
In the game that if you win, you'll get 100% of your bet money back.
1st loss = 1$
2nd loss = bet 2$ : if win, get 2$ / real profit = 1$ ( 2-1 )
3rd loss = bet 4$ : if win, get 4$ / real profit = 1$ ( 4 - ( 2+1) )
4th loss = bet 8$ : if win, get 8$ / real profit = 1$ ( 8 - ( 4+2+1 ) )
...
...
10th loss = bet 512$ : if win, get 512$ / real profit = 1$ ( 512 - ( 256+128+64+32+16+8+4+2+1) )
as you can see, the next bet will be first bet x 2^(n-1)
and the profit will equal to your first bet.
==================
In trading and forex EA ( Expert Advisor or bot ) people use this strategy to fool newbies that their martingale system will generate steady income for eternity.
But in reality, this strategy will destroy your whole portfolio eventually some time in the future. Because there will be some "Blackswan event" in market at some point in time. And one who ignore this fact, will lose everything.
But, if you using low risk strategy and generate some profit from your low-risk portfolio. You can take small chunk of that profit and put it in riskier strategy like this martingale, to accerelate your profit snowball.
===================
Parameter Explaination
====================
Price = datasource for indicator calculation
Fixed position size option = if uncheck, the "Start position size" parameter will be % of your initial capital. If checked, it will fixed position size ( like 1 BTC )
Start Position Logic = condition to enter first trade
- MACD singal > 0 : Self explanatory, default macd value
- Stochastic RSI cross up : enter when sto line cross up from bottom ( 20 )
- ATR channel : enter trade if price cross above 2.3 ATR
Take Profit Percent = take profit target % from average entry
Start martingale ..= if price compare to average position entry less than this %, it will start to double down ( martingale )
Martingale Multiplier = you can specific how big you'll double down, default is 2
Trade Direction = long only for now
Use date rang = self explanatory
** make sure to setup your initial capital in properties tab **
On chart
=======
White Line = Average position price
Orange Line = your current equity
If equity less than 0, it will close any remaining positions ( It's mean your position got liquidated )
If price > equity line for "take profit percent" it will close any remaining positions.
=======
As you can see, this strategy survive 2018 drop and pump profit to 1000+% ( Check in the strategy tester tab > list of trades )
But in May 2020 -50% drop in just 3 days, your whole portfolio got liquidated.
Actually, after some digging in profit and backtest result.
This strategy, when it can survive a shape drop, can generate a lot of profit.
So, if you want to use martingale. Make sure to use only small chunk of your profit from "low-risk" strategy to accelerate your profit generation ( aka degen port )
DO NOT greedy and use all of your initial capital or borrowed money to use with this strategy!

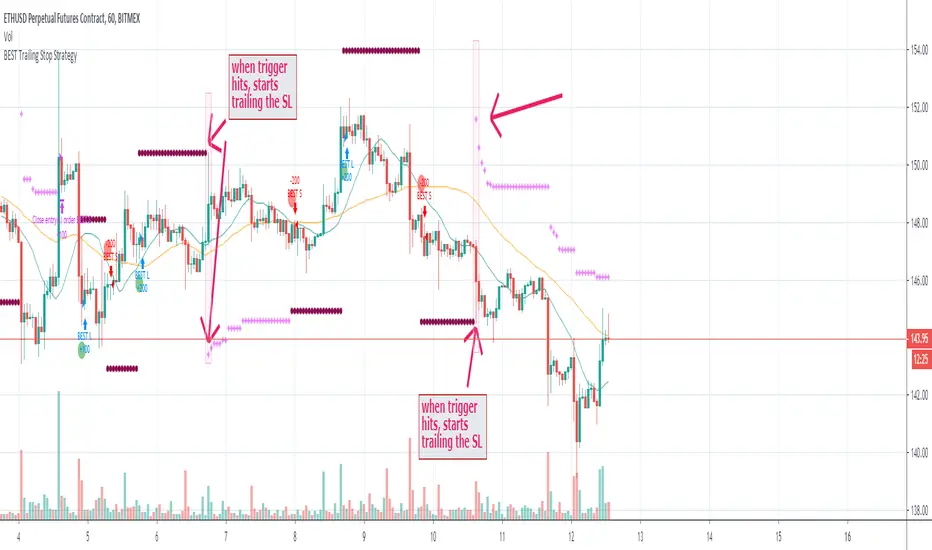
BEST Trailing Stop StrategyHello traders
Here we go again.... with the second strategy snippet.
Reminder: the first snipper was a Trailing Profit strategy script
What's on the menu?
A trailing stop is designed to protect gains by enabling a trade to remain open and continue to profit as long as the price is moving in the investor's favor.
The order closes the trade if the price changes direction by a specified percentage or dollar amount.
Trigger me I'm famous
I developed many trading strategies in my career and often I've been asked to trigger a trailing-stop once a certain % move has been made.
On the screenshot below, the SL trigger is plotted in maroon.
Once the price goes past that level for the first time, I'll start trailing the trailing stop level.
In other words, when we see a price makes an interesting move in percentage value - we decide to trail the stop for at least not losing any more
All the BEST
Dave
TradingView Alerts to MT4 MT5 + dynamic variables NON-REPAINTINGAccidentally, I’m sharing open-source profitable Forex strategy. Accidentally, because this was aimed to be purely educational material. A few days ago TradingView released a very powerful feature of dynamic values from PineScript now being allowed to be passed in Alerts. And thanks to TradingConnector, they could be instantly executed in MT4 or MT5 platform of any broker in the world. So yeah - TradingConnector works with indices and commodities, too.
The logic of this EURUSD 6h strategy is very simple - it is based on Stochastic crossovers with stop-loss set under most recent pivot point. Setting stop-loss with surgical precision is possible exactly thanks to allowance of dynamic values in alerts. TradingConnector has been also upgraded to take advantage of these dynamic values and it now enables executing trades with pre-calculated stop-loss, take-profit, as well as stop and limit orders.
Another fresh feature of TradingConnector, is closing positions only partly - provided that the broker allows it, of course. A position needs to have trade_id specified at entry, referred to in further alerts with partial closing. Detailed spec of alerts syntax and functionalities can be found at TradingConnector website. How to include dynamic variables in alert messages can be seen at the very end of the script in alertcondition() calls.
The strategy also takes commission into consideration.
Slippage is intentionally left at 0. Due to shorter than 1 second delivery time of TradingConnector, slippage is practically non-existing. This can be achieved especially if you’re using VPS server, hosted in the same datacenter as your brokers’ servers. I am using such setup, it is doable. Small slippage and spread is already included in commission value.
This strategy is NON-REPAINTING and uses NO TRAILING-STOP or any other feature known to be faulty in TradingView backtester. Does it make this strategy bulletproof and 100% success-guaranteed? Hell no! Remember the no.1 rule of backtesting - no matter how profitable and good looking a script is, it only tells about the past. There is zero guarantee the same strategy will get similar results in the future.
To turn this script into study so that alerts can be produced, do 2 things:
1. comment “strategy” line at the beginning and uncomment “study” line
2. comment lines 54-59 and uncomment lines 62-65.
Then add script to the chart and configure alerts.
This script was build for educational purposes only.
Certainly this is not financial advice. Anybody using this script or any of its parts in any way, must be aware of high risks connected with trading.
Thanks @LucF and @a.tesla2018 for helping me with code fixes :)

Trade Manager (Open Source Version)Hello my young padawans looking for the FORCE to get richer on your next trade
I got pinged at least three times today asking where the hell is the indicator of the day. You asked, I delivered :)
Here's your free open-source Trade Manager Version. My associates might kill me for sharing that one... anyway this is a real GIFT.
I won't share such quality indicators too often for FREE so hope you'll appreciate its value. It can really help with your day to day trading (on top of making your charts looking more awesome)
This is an even better version compared to my previous Trade Manager Trade-Manager . It's basically a standalone version, meaning you'll have to update with 2 lines your own indicator and follow my educational post from yesterday (pasted it below also) to learn how to do it
Please read this educational post I published for you before proceeding further : How-to-connect-your-indicator-with-the-Trade-Manager
From here you normally connected the data source of your own indicator to the Trade Manager. If not, here's a reminder of the article mentionned above
Step 1 - Update your indicator
For the screenshot you see above, I used this indicator : Two-MM-Cross-MACD/ . "But sir are you really advertising your other indicators here ??" ... hmmm.... YES but I gave them for free so ... stop complaining my friend :)
Somewhere in the code you'll have a LONG and a SHORT condition. If not, please go back to study trading for noobs (I'm kidding !!!)
So it should look to something similar
nUP = ma_crossover and macd_crossover
nDN = ma_crossunder and macd_crossunder
What you will need to add at the very end of your script is a Signal plot that will be captured by the Trade Manager. This will give us :
// Signal plot to be used as external
// if crossover, sends 1, otherwise sends -1
Signal = (nUP) ? 1 : (nDN) ? -1 : na
plot(Signal, title="Signal")
The Trade Manager engines expects to receive 1 for a bullishg signal and -1 for bearish .
Step 2 - Add the Trade Manager to your chart and select the right Data Source
I feel the questions coming so I prefer to anticipate :) When you add the Trade Manager to your chart, nothing will be displayed. THIS IS NORMAL because you'll have to select the Data Source to be "Signal"
Remember our Signal variable from the Two MM Cross from before, now we'll capture it and.....drumb rolll...... that's from that moment that your life became even more AWESOME
The Engine will capture the last signal from the MM cross or any indicator actually and will update the Stop Loss, Take Profit levels based on the parameters you set on the Trade Manager
It should work with any indicator as long as you're providing a plot Signal with values 1 and -1 . In any case, you can change the Trade Manager you'll find a better logic for your trading
Now let's cover the different parameters of the tool
It should be straightforward but better to explain everything here
+Label lines : if unchecked, no SL/TPs/... will be displayed
+Show Stop Loss Signal : Will display the stop loss label. You have the choice between three options :
By default, the Stop Loss is set to NONE. You'll have to select a different option to enable the Stop Loss for real
++Percentage : Will set the SL at a percent distance from the price
++Fixed : SL fixed at a static price
++Trailing % : Trailing stop loss based on percentage level
The following is a KEY feature and I got asked for it many times those past two days. I got annoyed of getting the same request so I just did it
++Trailing TP: Will move the Stop Loss if the take profit levels are hit
Example: if TP1 is hit, SL will be moved to breakeven. If TP2 is hit, SL will be moved from TP1 to TP2
+Take Profit 1,2,3 : Visually define the three Take Profit levels. Those are percentage levels .
Meaning if you set TP1 = 2, it will set the TP1 level 2% away from the entry signal
Please note that once a Take profit level is reached, it will magically disappear. This is to be expected
I'll share in the future a way more complete version with invalidation, stop loss/take profits based on indicator, take profit based on supports/resistances, ...
I believe is such a great tool because can be connected to any indicator. I confess that I tried it only with a few... if you find any that's not working with the Trade manager, please let me know and I'll have a look
PS
I want to give a HUUUUUUUGE shoutout to the PineCoders community who helped me finishing it
Wishing you all the best and a pleasant experience with my work
David

Peak Valley Estimation StrategyIntroduction
Its the first strategy that i post here, so don't expect ground breaking stuff, when testing my indicators i always used prorealtime and not tradingview. This strategy use signals generated by the peak/valley estimator indicator i posted long ago, i think the signals generated where sometimes quite accurate in some markets thus providing potential material for a profitable strategy.
The indicator use 3 parameters, therefore the optimisation process is not easy, but i selected what i judged good parameters values at first glance. The strategy is in its more simple form without stop or anything, the detection of peaks and valley can allow for tighter stops since we expect the price to reverse, but take into account that sops and take profits are parameters subject to optimization process except if selected with strict money management rules and not profit optimization.
Of course trading the strategy in this form is far from being great, if we take into account the market non stationarity then we might expect loss during trending markets. Trend strength indicators could help switch from a reversal to breakout strategy thus maybe providing more control.
I really hope you find an use for the strategy.
Notes
Its been three long years since i started tradingview, and i put more efforts in my indicators than in my studies and life overall, this have created complicated situations and i can't afford to follow up with this, therefore i announce that in the end of june i will leave tradingview for quite a long time, at least until i have my degree. I announce it in advance in case some of you want helps of any kind. I will post all the indicators, both in progress and finished i have made during those three years. I hope you can all understand.
Thanks for reading !

makeTPSo this model try to use the the take profit issue as important
the model is based on the early model that I put in last publication , the problem is that the fire point of the buy and sell has a delay and shoot some bars after (its not repaint but a bug due to TV code) . but once it stay it will calculate correctly the take profits . so I add take profit 1 and take profit 2 to the script . and since take profit 1 is correct without delay I add option to use it as buy again or short again . you can the older entry point which is H= high or L =low as your initial buy point but be aware that it sometime shoot too late since the problem in TV script to transfer the price correctly .or to enter to buy again option which is based on take profit 1 . the H and L are correctly detecting most of the time the Highs and the lows so by going on the trend them you can use the TP which are by % to max out your gains .. this is the theory behind this model
see here on amazon the concept

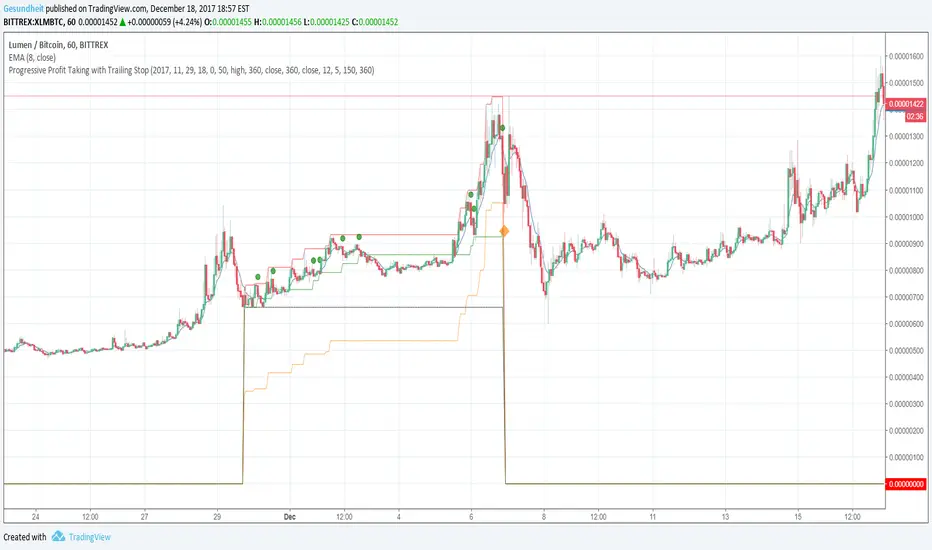
Progressive Profit Taking with Trailing StopThis is version 2 of
Special features:
Added partial profit taking as price rises. Profit taking is triggered by price crossing an EMA.
After profit taking, price has to rise by a user-specified percent before taking profits again.
Also includes condition for fully closing position after meeting specified profit target.
To incorporate into your algo, turn the plotshape functions into alertcondition.
Golden Cross, SMA 200 Moving Average Strategy (by ChartArt)This famous moving average strategy is very easy to follow to decide when to buy (go long) and when to take profit.
The strategy goes long when the faster SMA 50 (the simple moving average of the last 50 bars) crosses above the slower SMA 200. Orders are closed when the SMA 50 crosses below the SMA 200. This simple strategy does not have any other stop loss or take profit money management logic. The strategy does not short and goes long only!
Here is an article explaining the "golden cross" strategy in more detail:
www.stockopedia.com
On the S&P 500 index (symbol "SPX") this strategy worked on the daily chart 81% since price data is available since 1982. And on the DOW Jones Industrial Average (symbol "DOWI") this strategy worked on the daily chart 55% since price data is available since 1916. The low number of trades is in both cases not statistically significant though.
All trading involves high risk; past performance is not necessarily indicative of future results. Hypothetical or simulated performance results have certain inherent limitations. Unlike an actual performance record, simulated results do not represent actual trading. Also, since the trades have not actually been executed, the results may have under- or over-compensated for the impact, if any, of certain market factors, such as lack of liquidity. Simulated trading programs in general are also subject to the fact that they are designed with the benefit of hindsight. No representation is being made that any account will or is likely to achieve profits or losses similar to those shown.

Elder's Market Thermometer [LazyBear]Market temperature, introduced by Dr.Alexander Elder, helps differentiate between sleepy, quiet and hot market periods.
Following is Mr.Elder's explanation on how to use this indicator (from his book "Come in to my Trading Room"):
"When markets are quiet, the adjacent bars tend to overlap. The consensus of value is well established, and the crowd does little buying or selling outside of yesterday’s range. When highs and lows exceed their previous day’s values, they do so only by small margins. Market Thermometer falls and its EMA slants down, indicating a sleepy market. When a market begins to run, either up or down, its daily bars start pushing outside of the previous ranges. The histogram of Market Thermometer grows taller and crosses above its EMA, which soon turns up, confirming the new trend."
"Market Thermometer gives four trading signals, based on the relationship between its histogram and its moving average:
1) The best time to enter new positions is when Market Thermometer falls below its moving average. When Market Thermometer falls below its EMA, it indicates that the market is quiet. If your system flashes an entry signal, try to enter when the market is cooler than usual. When Market Thermometer rises above its moving average, it warns that the market is hot and slippage more likely.
2) Exit positions when Market Thermometer rises to triple the height of its moving average. A spike of Market Thermometer indicates a runaway move. When the crowd feels jarred by a sudden piece of news and surges, it is a good time to take profits. Panics tend to be short-lived, offering a brief opportunity to cash in. If the EMA of Market Thermometer stands at 5 cents, but the Thermometer itself shoots up to 15 cents, take profits. Test these values for the market you are trading.
3) Get ready for an explosive move if the Thermometer stays below its moving average for five to seven trading days. Quiet markets put amateurs to sleep. They become careless and stop watching prices. Volatility and volume fall, and professionals get a chance to run away with the market. Explosive moves often erupt from periods of inactivity.
4) Market Thermometer can help you set a profit target for the next trading day. If you are a short-term trader and are long, add the value of today’s Thermometer EMA to yesterday’s high and place a sell order there. If you are short, subtract the value of the Thermometer’s EMA from yesterday’s low and place an order to cover at that level."
You can configure the "Explosive Move threshold" (default: 3), "Idle Market Threshold" (default: 7) and "Thermometer EMA length" (default: 22) via Options page.
More info:
"Come in to my Trading Room - A complete Guide to Trading" by Dr.Alexander Elder. (Page 162)
List of my other indicators:
- Chart:
- GDoc: docs.google.com

RSI Fibonacci Flow [JOAT]RSI Fibonacci Flow - Advanced Fibonacci Retracement with RSI Confluence
Introduction
RSI Fibonacci Flow is an open-source overlay indicator that combines automatic Fibonacci retracement levels with RSI momentum analysis to identify high-probability trading zones. The indicator automatically detects swing highs and lows, draws Fibonacci levels, and generates confluence signals when RSI conditions align with key Fibonacci zones.
This indicator is designed for traders who use Fibonacci retracements but want additional confirmation from momentum analysis before entering trades.
Originality and Purpose
This indicator is NOT a simple mashup of RSI and Fibonacci tools. It is an original implementation that creates a synergistic relationship between two complementary analysis methods:
Why Combine RSI with Fibonacci? Fibonacci retracements identify WHERE price might reverse, but they don't tell you WHEN. RSI provides the timing component by showing momentum exhaustion. When price reaches the Golden Zone (50%-61.8%) AND RSI shows oversold conditions, the probability of a successful bounce increases significantly.
Original Confluence Scoring System: The indicator calculates a 0-5 confluence score that weights multiple factors: Golden Zone presence (+2), entry zone presence (+1), RSI extreme alignment (+1), RSI divergence (+1), and strong RSI momentum (+1). This scoring system is original to this indicator.
Automatic Pivot Detection: Unlike manual Fibonacci tools, this indicator automatically detects swing highs and lows using a configurable pivot algorithm, then draws Fibonacci levels accordingly. The pivot detection uses a center-bar comparison method that checks if a bar's high/low is the highest/lowest within the specified depth on both sides.
Dynamic Trend Awareness: The indicator determines trend direction based on pivot sequence (last pivot was high or low) and adjusts Fibonacci orientation accordingly. In uptrends, 0% is at swing low; in downtrends, 0% is at swing high.
Each component serves a specific purpose:
Fibonacci levels identify potential reversal zones based on natural price ratios
RSI provides momentum context to filter out low-probability setups
Confluence scoring quantifies setup quality for position sizing decisions
Automatic pivot detection removes subjectivity from level placement
Core Concept: RSI-Fibonacci Confluence
The most powerful trading setups occur when multiple factors align. RSI Fibonacci Flow identifies these moments by:
Automatically detecting price pivots and drawing Fibonacci levels
Tracking which Fibonacci zone the current price occupies
Monitoring RSI for overbought/oversold conditions
Generating signals when RSI extremes coincide with key Fibonacci levels
Scoring confluence strength on a 0-5 scale
When price reaches the Golden Zone (50%-61.8%) while RSI shows oversold conditions in an uptrend, the probability of a bounce increases significantly.
Fibonacci Levels Explained
The indicator draws nine Fibonacci levels based on the most recent swing:
0% (Swing Low/High): The starting point of the move
23.6%: Shallow retracement - often seen in strong trends
38.2%: First significant support/resistance level
50%: Psychological midpoint of the move
61.8% (Golden Ratio): The most important Fibonacci level
78.6%: Deep retracement - last defense before trend failure
100% (Swing High/Low): The end point of the move
127.2% (TP1): First extension target for take profit
161.8% (TP2): Second extension target for take profit
The Golden Zone
The area between 50% and 61.8% is highlighted as the "Golden Zone" because:
It represents the optimal retracement depth for trend continuation
Institutional traders often place orders in this zone
It offers favorable risk-to-reward ratios
Price frequently bounces from this area in healthy trends
When price enters the Golden Zone, the indicator highlights it with a semi-transparent box and optional background coloring.
Pivot Detection System
The indicator uses a configurable pivot detection algorithm:
pivotDetect(float src, int len, bool isHigh) =>
int halfLen = len / 2
float centerVal = nz(src , src)
bool isPivot = true
for i = 0 to len - 1
if isHigh
if nz(src , src) > centerVal
isPivot := false
break
else
if nz(src , src) < centerVal
isPivot := false
break
isPivot ? centerVal : float(na)
This identifies swing highs and lows by checking if a bar's high/low is the highest/lowest within the specified depth on both sides.
Visual Components
1. Fibonacci Lines
Horizontal lines at each Fibonacci level:
Solid lines for major levels (0%, 50%, 61.8%, 100%)
Dashed lines for secondary levels (23.6%, 38.2%, 78.6%)
Dotted lines for extension levels (127.2%, 161.8%)
Color-coded for easy identification
Configurable line width
2. Fibonacci Labels
Price labels at each level showing:
Fibonacci percentage
Actual price at that level
Golden Zone label highlighted
TP1 and TP2 labels for targets
3. Golden Zone Box
A semi-transparent box highlighting the 50%-61.8% zone:
Gold colored border and fill
Extends from swing start to current bar (or beyond if extended)
Provides clear visual of the optimal entry zone
4. ZigZag Lines
Connecting lines between detected pivots:
Cyan for moves from low to high
Orange for moves from high to low
Helps visualize market structure
Configurable line width
5. Pivot Markers
Small labels at detected swing points:
"HH" (Higher High) at swing highs
"LL" (Lower Low) at swing lows
Helps track market structure
6. Entry Signals
BUY and SELL labels when confluence conditions are met:
BUY: RSI oversold + price in entry zone + uptrend + positive momentum
SELL: RSI overbought + price in entry zone + downtrend + negative momentum
Labels include "RSI+FIB" to indicate confluence
Confluence Scoring System
The indicator calculates a confluence score from 0 to 5:
+2 points: Price is in the Golden Zone (50%-61.8%)
+1 point: Price is in the entry zone (38.2%-61.8%)
+1 point: RSI is oversold in uptrend OR overbought in downtrend
+1 point: RSI divergence detected (bullish or bearish)
+1 point: Strong RSI momentum (change > 2 points)
Confluence ratings:
STRONG (4-5): Multiple factors align - high probability setup
MODERATE (2-3): Some factors align - proceed with caution
WEAK (0-1): Few factors align - wait for better setup
Dashboard Panel
The 10-row dashboard provides comprehensive analysis:
RSI Value: Current RSI reading (large text)
RSI State: OVERBOUGHT, OVERSOLD, BULLISH, BEARISH, or NEUTRAL
Fib Trend: UPTREND or DOWNTREND based on last pivot sequence
Price Zone: Current Fibonacci zone (e.g., "GOLDEN ZONE", "38.2% - 50%")
Price: Current close price (large text)
Confluence: Score rating with numeric value (e.g., "STRONG (4/5)")
Nearest Fib: Closest key Fibonacci level with price
TP1 (127.2%): First take profit target price
TP2 (161.8%): Second take profit target price
Input Parameters
Pivot Detection:
Pivot Depth: Bars to look back for swing detection (default: 10)
Min Deviation %: Minimum price move to confirm pivot (default: 1.0)
RSI Settings:
RSI Length: Period for RSI calculation (default: 14)
Source: Price source (default: close)
Overbought: Upper threshold (default: 70)
Oversold: Lower threshold (default: 30)
Fibonacci Display:
Show Fib Lines: Toggle Fibonacci lines (default: enabled)
Show Fib Labels: Toggle price labels (default: enabled)
Show Golden Zone Box: Toggle zone highlight (default: enabled)
Line Width: Thickness of Fibonacci lines (default: 2)
Extend Fib Lines: Extend lines into future (default: enabled)
ZigZag:
Show ZigZag: Toggle connecting lines (default: enabled)
ZigZag Width: Line thickness (default: 2)
Signals:
Show Entry Signals: Toggle BUY/SELL labels (default: enabled)
Show TP Levels: Toggle take profit in dashboard (default: enabled)
Show RSI-Fib Confluence: Toggle confluence analysis (default: enabled)
Dashboard:
Show Dashboard: Toggle information panel (default: enabled)
Position: Choose corner placement
Colors:
Bullish: Color for bullish elements (default: cyan)
Bearish: Color for bearish elements (default: orange)
Neutral: Color for neutral elements (default: gray)
Golden Zone: Color for Golden Zone highlight (default: gold)
How to Use RSI Fibonacci Flow
Identifying Entry Zones:
Wait for price to retrace to the 38.2%-61.8% zone
Check if RSI is approaching oversold (for longs) or overbought (for shorts)
Look for STRONG confluence rating in the dashboard
Enter when BUY or SELL signal appears
Setting Take Profit Targets:
TP1 at 127.2% extension for conservative target
TP2 at 161.8% extension for aggressive target
Consider scaling out at each level
Using the Price Zone:
"BELOW 23.6%" - Price hasn't retraced much; wait for deeper pullback
"23.6% - 38.2%" - Shallow retracement; strong trend continuation possible
"38.2% - 50%" - Good entry zone for trend trades
"GOLDEN ZONE" - Optimal entry zone; highest probability
"61.8% - 78.6%" - Deep retracement; trend may be weakening
"78.6% - 100%" - Very deep; trend reversal possible
"ABOVE/BELOW 100%" - Trend has likely reversed
Confluence Trading Strategy:
Only take trades with confluence score of 3 or higher
STRONG confluence (4-5) warrants larger position size
MODERATE confluence (2-3) warrants smaller position size
WEAK confluence (0-1) - wait for better setup
Alert Conditions
Ten alert conditions are available:
RSI-Fib BUY Signal: Strong bullish confluence detected
RSI-Fib SELL Signal: Strong bearish confluence detected
Price in Golden Zone: Price enters 50%-61.8% zone
New Pivot High: Swing high detected
New Pivot Low: Swing low detected
RSI Overbought: RSI crosses above overbought threshold
RSI Oversold: RSI crosses below oversold threshold
Bullish Divergence: Potential bullish RSI divergence
Bearish Divergence: Potential bearish RSI divergence
Strong Confluence: Confluence score reaches 4 or higher
Understanding Trend Direction
The indicator determines trend based on pivot sequence:
UPTREND: Last pivot was a low after a high (expecting move up)
DOWNTREND: Last pivot was a high after a low (expecting move down)
Fibonacci levels are drawn accordingly:
In uptrend: 0% at swing low, 100% at swing high
In downtrend: 0% at swing high, 100% at swing low
Bar Coloring
When confluence features are enabled:
Cyan bars on strong bullish signals
Orange bars on strong bearish signals
Gold-tinted bars when price is in Golden Zone
Best Practices
Use on 1H timeframe or higher for more reliable pivots
Adjust Pivot Depth based on timeframe (higher for longer timeframes)
Wait for price to enter Golden Zone before considering entries
Confirm RSI is in favorable territory before trading
Use extension levels (127.2%, 161.8%) for realistic profit targets
Combine with support/resistance and candlestick patterns
Higher confluence scores indicate higher probability setups
Limitations
Pivot detection has inherent lag (must wait for confirmation)
Fibonacci levels are subjective - different swings produce different levels
Works best in trending markets with clear swings
RSI can remain overbought/oversold in strong trends
Not all Golden Zone entries will be successful
The source code is open and available for review and modification.
Disclaimer
This indicator is provided for educational and informational purposes only. It is not financial advice. Trading involves substantial risk of loss. Past performance does not guarantee future results. Fibonacci levels are not guaranteed support/resistance - they are probability zones based on historical price behavior. Always conduct your own analysis and use proper risk management.
- Made with passion by officialjackofalltrades :D

LO1_TradersPostLibrary "LO1_TradersPost"
Enhanced TradersPost integration library with comprehensive order management
_buildJSONField(key, value, required)
Build a JSON field with proper handling of required vs optional fields
Parameters:
key (string) : The JSON key name
value (string) : The value to include (any type, will be converted to string)
required (bool) : If true, field is always included even if value is na/empty
Returns: String containing JSON field or empty string if optional and na/empty
_buildConditionalField(key, value)
Build a conditional JSON field that's only included if value is valid
Parameters:
key (string) : The JSON key name
value (string) : The value to include
Returns: String containing JSON field or empty string if value is na/empty
_buildConditionalNumericField(key, value)
Build a conditional JSON field for numeric values
Parameters:
key (string) : The JSON key name
value (float) : The numeric value
Returns: String containing JSON field or empty string if value is na
_buildNestedObject(objectType, price, amount, percent, stopType, limitPrice, trailAmount, trailPercent)
Build nested JSON objects for takeProfit/stopLoss
Parameters:
objectType (string) : The type of object being built ("takeProfit" or "stopLoss")
price (float) : The limit price for TP or stop price for SL
amount (float) : The dollar amount (optional)
percent (float) : The percentage (optional)
stopType (series StopLossType) : The stop loss type - only for stopLoss
limitPrice (float) : The limit price for stop_limit orders - only for stopLoss
trailAmount (float) : Trailing amount for trailing stops - only for stopLoss
trailPercent (float) : Trailing percent for trailing stops - only for stopLoss
Returns: String containing nested JSON object or empty string if no valid data
_validateAndBuildJSON(ticker, action, quantity, quantityType, orderType, sentiment, cancel, timeInForce, limitPrice, stopPrice, trailAmount, trailPercent, takeProfitPrice, takeProfitAmount, takeProfitPercent, stopLossPrice, stopLossAmount, stopLossPercent, stopLossType, stopLossLimitPrice, extendedHours, optionType, intrinsicValue, expiration, strikePrice, signalPrice, comment)
Master JSON builder that validates parameters and constructs JSON
Parameters:
ticker (string) : The trading symbol
action (series Action) : The order action (buy, sell, exit, etc.)
quantity (float) : The order quantity
quantityType (series QuantityType) : The type of quantity (fixed, dollar, percent)
orderType (series OrderType) : The order type (market, limit, stop, etc.)
sentiment (series Sentiment) : The position sentiment (long, short, flat) - optional
cancel (bool) : Controls order cancellation (true = cancel existing orders, false = don't cancel)
timeInForce (series TimeInForce) : Time in force for the order (DAY, GTC, IOC, FOK)
limitPrice (float) : Price for limit orders
stopPrice (float) : Price for stop orders
trailAmount (float) : Trailing amount for trailing stops
trailPercent (float) : Trailing percent for trailing stops
takeProfitPrice (float) : Take profit limit price (absolute)
takeProfitAmount (float) : Take profit dollar amount (relative)
takeProfitPercent (float) : Take profit percentage (relative)
stopLossPrice (float) : Stop loss price (absolute)
stopLossAmount (float) : Stop loss dollar amount (relative)
stopLossPercent (float) : Stop loss percentage (relative)
stopLossType (series StopLossType) : Stop loss order type
stopLossLimitPrice (float) : Limit price for stop_limit orders
extendedHours (bool) : Enable extended hours trading (boolean)
optionType (series OptionType) : Option type for options trading (both/call/put)
intrinsicValue (series IntrinsicValue) : Intrinsic value filter for options (itm/otm)
expiration (string) : Option expiration (date string)
strikePrice (float) : Option strike price
signalPrice (float) : The market price at alert time (for slippage tracking)
comment (string) : Optional comment for the order (shows in TradersPost UI for debugging)
Returns: ErrorResponse with success status and JSON string or error details
ValidateOrder(ticker, action, orderType, limitPrice, stopPrice)
Validate order parameters before JSON construction
Parameters:
ticker (string) : Trading symbol
action (series Action) : Order action
orderType (series OrderType) : Order type (market, limit, stop, etc.)
limitPrice (float) : Limit price for limit orders
stopPrice (float) : Stop price for stop orders
Returns: ErrorResponse with validation results
ValidateQuantity(quantity, quantityType)
Validate quantity based on type and constraints
Parameters:
quantity (float) : The quantity value
quantityType (series QuantityType) : The type of quantity
Returns: ErrorResponse with validation results
ValidatePrices(entryPrice, stopPrice, takeProfitPrice, action)
Validate price relationships and values
Parameters:
entryPrice (float) : Entry price for the order
stopPrice (float) : Stop loss price
takeProfitPrice (float) : Take profit price
action (series Action) : Order action (buy/sell)
Returns: ErrorResponse with validation results
ValidateSymbol(ticker)
Validate trading symbol format
Parameters:
ticker (string) : The symbol to validate
Returns: ErrorResponse with validation results
CombineValidationResults(validationResults)
Create validation error collection and reporting system
Parameters:
validationResults (array) : Array of ErrorResponse objects from multiple validations
Returns: Combined ErrorResponse with all validation results
ValidateCompleteOrder(ticker, action, quantity, quantityType, orderType, limitPrice, stopPrice, takeProfitPrice)
Comprehensive validation for all order parameters
Parameters:
ticker (string) : Trading symbol
action (series Action) : Order action
quantity (float) : Order quantity
quantityType (series QuantityType) : Type of quantity
orderType (series OrderType) : Order type
limitPrice (float) : Limit price (optional)
stopPrice (float) : Stop price (optional)
takeProfitPrice (float) : Take profit price (optional)
Returns: ErrorResponse with complete validation results
CreateErrorResponse(success, errorMessages, message, severity, context, functionName)
Create standardized error response
Parameters:
success (bool) : Whether the operation succeeded
errorMessages (array) : Array of error messages
message (string) : Summary message
severity (series ErrorSeverity) : Error severity level
context (string) : Context where error occurred
functionName (string) : Name of function that generated error
Returns: EnhancedErrorResponse with all error details
HandleValidationError(validationResult, context, functionName)
Handle validation errors with context
Parameters:
validationResult (ErrorResponse) : The validation result to handle
context (string) : Description of what was being validated
functionName (string) : Name of calling function
Returns: Processed error response with enhanced context
LogError(errorResponse, displayOnChart)
Log error with appropriate level
Parameters:
errorResponse (EnhancedErrorResponse) : The error response to log
displayOnChart (bool) : Whether to show error on chart
CreateSuccessResponse(message, context, functionName)
Create success response
Parameters:
message (string) : Success message
context (string) : Context of successful operation
functionName (string) : Name of function
Returns: Success response
_validateJSONConstruction(jsonString)
Validate JSON construction and handle malformed data
Parameters:
jsonString (string) : The constructed JSON string
Returns: ErrorResponse indicating if JSON is valid
CreateDetailedError(success, errors, warnings, severity, context)
Create detailed error response with context
Parameters:
success (bool) : Operation success status
errors (array) : Array of error messages
warnings (array) : Array of warning messages
severity (series ErrorSeverity) : Error severity level
context (string) : Context where error occurred
Returns: DetailedErrorResponse object
LogDetailedError(response)
Log detailed error response with appropriate severity
Parameters:
response (DetailedErrorResponse) : DetailedErrorResponse to log
Returns: Nothing - logs to Pine Script console
CombineIntoDetailedResponse(responses, context)
Combine multiple error responses into detailed response
Parameters:
responses (array) : Array of ErrorResponse objects to combine
context (string) : Context for the combined operation
Returns: DetailedErrorResponse with combined results
SendAdvancedOrder(ticker, action, quantity, quantityType, orderType, sentiment, cancel, limitPrice, stopPrice, trailAmount, trailPercent, takeProfitPrice, takeProfitAmount, takeProfitPercent, stopLossPrice, stopLossAmount, stopLossPercent, stopLossType, stopLossLimitPrice, extendedHours, optionType, intrinsicValue, expiration, strikePrice, signalPrice, comment)
Send advanced order with comprehensive parameter validation and JSON construction
Parameters:
ticker (string) : Symbol to trade (defaults to syminfo.ticker)
action (series Action) : Order action (buy/sell/exit/cancel/add)
quantity (float) : Order quantity
quantityType (series QuantityType) : Type of quantity (fixed/dollar/percent)
orderType (series OrderType) : Type of order (market/limit/stop/stop_limit/trailing_stop)
sentiment (series Sentiment) : Position sentiment (long/short/flat, optional)
cancel (bool) : Controls order cancellation (true = cancel existing, false = don't cancel, na = use defaults)
limitPrice (float) : Limit price for limit orders
stopPrice (float) : Stop price for stop orders
trailAmount (float) : Trailing amount for trailing stops
trailPercent (float) : Trailing percent for trailing stops
takeProfitPrice (float) : Take profit limit price (absolute)
takeProfitAmount (float) : Take profit dollar amount (relative)
takeProfitPercent (float) : Take profit percentage (relative)
stopLossPrice (float) : Stop loss price (absolute)
stopLossAmount (float) : Stop loss dollar amount (relative)
stopLossPercent (float) : Stop loss percentage (relative)
stopLossType (series StopLossType) : Stop loss order type
stopLossLimitPrice (float) : Limit price for stop_limit orders
extendedHours (bool) : Enable extended hours trading (boolean)
optionType (series OptionType) : Option type for options trading (both/call/put)
intrinsicValue (series IntrinsicValue) : Intrinsic value filter for options (itm/otm)
expiration (string) : Option expiration (date string)
strikePrice (float) : Option strike price
signalPrice (float) : The market price at alert time (for slippage tracking)
comment (string) : Optional comment for the order (shows in TradersPost UI for debugging)
Returns: ErrorResponse with success status and JSON or error details
SendSentiment(ticker, sentiment, quantity, quantityType, signalPrice, comment)
Send sentiment-based position management order
Parameters:
ticker (string) : Symbol to manage (defaults to syminfo.ticker)
sentiment (series Sentiment) : Target position sentiment (long/short/flat)
quantity (float) : Position size (optional, uses account default if not specified)
quantityType (series QuantityType) : Type of quantity specification
signalPrice (float) : The market price at alert time (for slippage tracking)
comment (string) : Optional comment
Returns: ErrorResponse with success status
SendCancelAll(ticker, comment)
Cancel all open orders for the specified symbol
Parameters:
ticker (string) : Symbol to cancel orders for (defaults to syminfo.ticker)
comment (string) : Optional comment for the cancellation
Returns: ErrorResponse with success status
SendOrderNoCancelExisting(ticker, action, quantity, quantityType, orderType, sentiment, limitPrice, stopPrice, takeProfitPrice, takeProfitAmount, takeProfitPercent, stopLossPrice, stopLossAmount, stopLossPercent, stopLossType, stopLossLimitPrice, signalPrice, comment)
Send order without canceling existing orders
Parameters:
ticker (string) : Symbol to trade (defaults to syminfo.ticker)
action (series Action) : Order action (buy/sell/exit)
quantity (float) : Order quantity
quantityType (series QuantityType) : Type of quantity (fixed/dollar/percent)
orderType (series OrderType) : Type of order (market/limit/stop/stop_limit)
sentiment (series Sentiment) : Position sentiment (long/short/flat, optional)
limitPrice (float) : Limit price for limit orders
stopPrice (float) : Stop price for stop orders
takeProfitPrice (float) : Take profit price
takeProfitAmount (float) : Take profit amount (optional)
takeProfitPercent (float)
stopLossPrice (float) : Stop loss price
stopLossAmount (float) : Stop loss amount (optional)
stopLossPercent (float) : Stop loss percentage (optional)
stopLossType (series StopLossType) : Stop loss order type
stopLossLimitPrice (float) : Limit price for stop_limit orders
signalPrice (float) : The market price at alert time (for slippage tracking)
comment (string) : Optional comment
Returns: ErrorResponse with success status
_buildBracketOrderParams(orderType, entryPrice, entryLimitPrice)
Build bracket order parameters by routing entryPrice to correct parameter based on orderType
This helper function maps the conceptual "entryPrice" to the technical parameters needed
Parameters:
orderType (series OrderType) : The order type for the entry order
entryPrice (float) : The desired entry price (trigger for stops, limit for limits)
entryLimitPrice (float) : The limit price for stop_limit orders (optional)
Returns: array with correct routing
SendBracketOrder(ticker, action, quantity, quantityType, orderType, entryPrice, entryLimitPrice, takeProfitPrice, stopLossPrice, takeProfitAmount, takeProfitPercent, stopLossAmount, stopLossPercent, stopLossType, stopLossLimitPrice, signalPrice, comment)
Send bracket order (entry + take profit + stop loss)
Parameters:
ticker (string) : Symbol to trade
action (series Action) : Entry action (buy/sell)
quantity (float) : Order quantity
quantityType (series QuantityType) : Type of quantity specification
orderType (series OrderType) : Type of entry order
entryPrice (float) : Entry price (trigger price for stop orders, limit price for limit orders)
entryLimitPrice (float) : Entry limit price (only for stop_limit orders, defaults to entryPrice if na)
takeProfitPrice (float) : Take profit price
stopLossPrice (float) : Stop loss price
takeProfitAmount (float) : Take profit dollar amount (alternative to price)
takeProfitPercent (float) : Take profit percentage (alternative to price)
stopLossAmount (float) : Stop loss dollar amount (alternative to price)
stopLossPercent (float) : Stop loss percentage (alternative to price)
stopLossType (series StopLossType) : Stop loss order type
stopLossLimitPrice (float) : Limit price for stop_limit orders
signalPrice (float) : The market price at alert time (for slippage tracking)
comment (string) : Optional comment
Returns: ErrorResponse with success status
SendOTOOrder(primaryTicker, primaryAction, primaryQuantity, primaryOrderType, primaryPrice, secondaryTicker, secondaryAction, secondaryQuantity, secondaryOrderType, secondaryPrice, signalPrice, comment)
Send One-Triggers-Other (OTO) order sequence
Note: OTO linking must be configured in TradersPost strategy settings
This sends two separate orders - TradersPost handles the OTO logic
Parameters:
primaryTicker (string) : Primary order ticker
primaryAction (series Action) : Primary order action
primaryQuantity (float) : Primary order quantity
primaryOrderType (series OrderType) : Primary entry type
primaryPrice (float) : Primary order price
secondaryTicker (string) : Secondary order ticker (defaults to primary ticker)
secondaryAction (series Action) : Secondary order action
secondaryQuantity (float) : Secondary order quantity
secondaryOrderType (series OrderType) : Secondary entry type
secondaryPrice (float) : Secondary order price
signalPrice (float) : The market price at alert time (for slippage tracking)
comment (string) : Optional comment for both orders
Returns: ErrorResponse with success status
SendOCOOrder(ticker, firstAction, firstQuantity, firstOrderType, firstPrice, secondAction, secondQuantity, secondOrderType, secondPrice, signalPrice, comment)
Send One-Cancels-Other (OCO) order pair
Note: OCO linking must be configured in TradersPost strategy settings
This sends two separate orders - TradersPost handles the OCO logic
Parameters:
ticker (string) : Symbol for both orders
firstAction (series Action) : Action for first order
firstQuantity (float) : Quantity for first order
firstOrderType (series OrderType) : Order type for first order
firstPrice (float) : Price for first order
secondAction (series Action) : Action for second order
secondQuantity (float) : Quantity for second order
secondOrderType (series OrderType) : Order type for second order
secondPrice (float) : Price for second order
signalPrice (float) : The market price at alert time (for slippage tracking)
comment (string) : Optional comment
Returns: ErrorResponse with success status
ErrorResponse
Fields:
success (series bool)
errors (array)
message (series string)
EnhancedErrorResponse
Fields:
success (series bool)
errors (array)
message (series string)
severity (series ErrorSeverity)
context (series string)
timestamp (series int)
functionName (series string)
DetailedErrorResponse
Fields:
success (series bool)
errors (array)
warnings (array)
severity (series ErrorSeverity)
context (series string)
message (series string)

Market Regime | NY Session Killzones Indicator [ApexLegion]Market Regime | NY Session Killzones Indicator
Introduction and Theoretical Background
The Market Regime | NY Session Killzones indicator is designed exclusively for New York market hours (07:00-16:00 ET). Unlike universal indicators that attempt to function across disparate global sessions, this tool employs session-specific calibration to target the distinct liquidity characteristics of the NY trading day: Pre-Market structural formation (08:00-09:30), the Morning breakout window (09:30-12:00), and the Afternoon Killzone (13:30-16:00)—periods when institutional order flow exhibits the highest concentration and most definable technical structure. By restricting its operational scope to these statistically significant time windows, the indicator focuses on signal relevance while filtering the noise inherent in lower-liquidity overnight or extended-hours trading environments.
I. TECHNICAL RATIONALE: THE PRINCIPLE OF CONTEXTUAL FUSION
1. The Limitation of Acontextual Indicators
Traditional technical indicators often fail because they treat every bar and every market session equally, applying static thresholds (e.g., RSI > 70) without regard for the underlying market structure or liquidity environment. However, institutional volume and market volatility are highly dependent on the time of day (session) and the prevailing long-term risk environment.
This indicator was developed to address this "contextual deficit" by fusing three distinct yet interdependent analytical layers:
• Time and Structure (Macro): Identifying high-probability trading windows (Killzones) and critical structural levels (Pre-Market Range, PDH/PDL).
• Volatility and Scoring (Engine): Normalizing intraday momentum against annual volatility data to create an objective, statistically grounded AI Score.
• Risk Management (Execution): Implementing dynamic, volatility-adjusted Stop Loss (SL) and Take Profit (TP) parameters based on the Average True Range (ATR).
2. The Mandate for 252-Day Normalization (Z-Score)
What makes this tool unique is its 252-day Z-Score normalization engine that transforms raw momentum readings into statistically grounded probability scores, allowing the same indicator to deliver consistent, context-aware signals across any timeframe—from 1-minute scalping to 1-hour swing trades—without manual recalibration.
THE PROBLEM OF SCALE INVARIANCE
A high Relative Strength Index (RSI) reading on a 1-minute chart has a completely different market implication than a high RSI reading on a Daily chart. Simple percentage-based thresholds (like 70 or 30) do not provide true contextual significance. A sudden spike in momentum may look extreme on a 5-minute chart, but if it is statistically insignificant compared to the overall volatility of the last year, it may be a poor signal.
THE SOLUTION: CROSS-TIMEFRAME Z-SCORE NORMALIZATION
This indicator utilizes the Pine Script function request.security to reference the Daily timeframe for calculating the mean (μ) and standard deviation (σ) of a momentum oscillator (RSI) over the past 252 trading days (one year).
The indicator then calculates the Z-Score (Z) for the current bar's raw momentum (x): Z = (x - μ) / σ
Core Implementation: float raw_rsi = ta.rsi(close, 14) // x
= request.security(syminfo.tickerid, "D",
, // σ (252 days)
lookahead=barmerge.lookahead_on)
float cur_rsi_norm = d_rsi_std != 0 ? (raw_rsi - d_rsi_mean) / d_rsi_std : 0.0 // Z
This score provides an objective measurement of current intraday momentum significance by evaluating its statistical extremity against the yearly baseline of daily momentum. This standardized approach provides the scoring engine with consistent, global contextual information, independent of the chart's current viewing timeframe.
II. CORE COMPONENTS AND TECHNICAL ANALYSIS BREAKDOWN
1. TIME AND SESSION ANALYSIS (KILLZONES AND BIAS)
The indicator visually segments the trading day based on New York (NY) trading sessions, aligning the analysis with periods of high institutional liquidity events.
Pre-Market (PRE)
• Function: Defines the range before the core market opens. This range establishes structural support and resistance levels (PMH/PML).
• Technical Implementation: Uses a dedicated Session input (ny_pre_sess). The High and Low values (pm_h_val/pm_l_val) within this session are stored and plotted for structural reference.
• Smart Extension Logic: PMH/PML lines are automatically extended until the next Pre-Market session begins, providing continuous support/resistance references overnight.
NY Killzones (AM/PM)
• Function: Highlights high-probability volatility windows where institutional liquidity is expected to be highest (e.g., NY open, lunch, NY close).
• Technical Implementation: Separate session inputs (kz_ny_am, kz_ny_pm) are utilized to draw translucent background fills, providing a clear visual cue for timing.
Market Regime Bias
• Function: Determines the initial directional premise for the trading day. The bias is confirmed when the price breaks either the Pre-Market High (PMH) or the Pre-Market Low (PML).
• Technical Implementation: Involves the comparison of the close price against the predefined structural levels (check_h for PMH, check_l for PML). The variable active_bias is set to Bullish or Bearish upon confirmed breakout.
Trend Bar Coloring
• Function: Applies a visual cue to the bars based on the established regime (Bullish=Cyan, Bearish=Red). This visual filter helps mitigate noise from counter-trend candles.
• Technical Implementation: The Pine Script barcolor() function is tied directly to the value of the determined active_bias.
2. VOLATILITY NORMALIZED SCORING ENGINE
The internal scoring mechanism accumulates points from multiple market factors to determine the strength and validity of a signal. The purpose is to apply a robust filtering mechanism before generating an entry.
The score accumulation logic is based on the following factors:
• Market Bias Alignment (+3 Points): Points are awarded for conformance with the determined active_bias (Bullish/Bearish).
• VWAP Alignment (+2 Points): Assesses the position of the current price relative to the Volume-Weighted Average Price (VWAP). Alignment suggests conformity with the average institutional transaction price.
• Volume Anomaly (+2 Points): Detects a price move accompanied by an abnormally high relative volume (odd_vol_spike). This suggests potential institutional participation or significant order flow.
• VIX Integration (+2 Points): A score derived from the CBOE VIX index, assessing overall market stability and stress. Stable VIX levels add points, while high VIX levels (stress regimes) remove points or prevent signal generation entirely.
• ML Probability Score (+3 Points): This is the core predictive engine. It utilizes a Log-Manhattan Distance Kernel to compare the current market state against historical volatility patterns. The script implements a Log-linear distance formula (log(1 + |Δ|) ). This approach mathematically dampens the impact of extreme volatility spikes (outliers), ensuring that the similarity score reflects true structural alignment rather than transient market noise.
Core Technical Logic (Z-Score Normalization)
float cur_rsi_norm = d_rsi_std != 0 ? (raw_rsi - d_rsi_mean) / d_rsi_std : 0.0
• Technical Purpose: This line calculates the Z-Score (cur_rsi_norm) of the current momentum oscillator reading (raw_rsi) by normalizing it against the mean (d_rsi_mean) and standard deviation (d_rsi_std) derived from 252 days of Daily momentum data. If the standard deviation is zero (market is perfectly flat), it safely returns 0.0 to prevent division by zero runtime errors. This allows the AI's probability score to be based on the current signal's significance within the context of the entire trading year.
3. EXECUTION AND RISK MANAGEMENT (ATR MODEL)
The indicator utilizes the Average True Range (ATR) volatility model. This helps risk management scale dynamically with market volatility by allowing users to define TP/SL distances independently based on the current ATR.
Stop Loss Multiplier (sl_mult)
• Function: Sets the Stop Loss (SL) distance as a configurable multiple of the current ATR (e.g., 1.5 × ATR).
• Technical Logic: The price level is calculated as: last_sl_price := close - (atr_val * sl_mult). The mathematical sign is reversed for short trades.
Take Profit Multiplier (tp_mult)
• Function: Sets the Take Profit (TP) distance as a configurable multiple of the current ATR (e.g., 3.0 × ATR).
• Technical Logic: The price level is calculated as: last_tp_price := close + (atr_val * tp_mult). The mathematical sign is reversed for short trades.
Structural SL Option
• Function: Provides an override to the ATR-based SL calculation. When enabled, it forces the Stop Loss to the Pre-Market High/Low (PMH/PML) level, aligning the stop with a key institutional structural boundary.
• Technical Logic: The indicator checks the use_struct_sl input. If true, the calculated last_sl_price is overridden with either pm_h_val or pm_l_val, dependent on the specific trade direction.
Trend Continuation Logic
• Function: Enables signal generation in established, strong trends (typically in the Afternoon session) based on follow-through momentum (a new high/low of the previous bar) combined with a high Signal Score, rather than exclusively relying on the initial PMH/PML breakout.
• Technical Logic: For a long signal, the is_cont_long logic specifically requires checks like active_bias == s_bull AND close > high , confirming follow-through momentum within the established regime.
Smart Snapping & Cleanup (16:00 Market Close)
• Function: To maintain chart cleanliness, all trade boxes (TP/SL), AI Prediction zones, Killzone overlays (NY AM/PM), and Liquidity lines (PDH/PDL) are automatically "snapped" and cut off precisely at 16:00 NY Time (Market Close).
• Technical Logic: When is_market_close condition is met (hour == 16 and minute == 0), the script executes cleanup logic that:
◦ Closes active trades and evaluates final P&L
◦ Snaps all TP/SL box widths to current bar
◦ Truncates AI Prediction ghost boxes at market close
◦ Cuts off NY AM/PM Killzone background fills
◦ Terminates PDH/PDL line extensions
◦ Prevents visual clutter from extending into post-market sessions
4. LIQUIDITY AND STRUCTURAL ANALYSIS
The indicator plots key structural levels that serve as high-probability magnet zones or areas of potential liquidity absorption.
• Pre-Market High/Low (PMH/PML): These are the high and low established during the configured pre-market session (ny_pre_sess). They define the primary structural breakout level for the day, often serving as the initial market inflection point or the key entry level for the morning session.
• PDH (Previous Day High): The high of the calendar day immediately preceding the current bar. This represents a key Liquidity Pool; large orders are often placed above this level, making it a frequent target for stop hunts or liquidity absorption by market makers.
• PDL (Previous Day Low): The low of the calendar day immediately preceding the current bar. This also represents a key Liquidity Pool and a high-probability reversal or accumulation point, particularly during the Killzones.
FIFO Array Management
The indicator uses FIFO (First-In-First-Out) array structures to manage liquidity lines and labels, automatically deleting the oldest objects when the count exceeds 500 to comply with drawing object limits.
5. AI PREDICTION BOX (PREDICTIVE MODEL)
Function: Analyzes AI scores and volatility to project predicted killzone ranges and duration with asymmetric directional bias.
A. DIRECTIONAL BIAS (ASYMMETRIC EXPANSION)
The prediction model calculates directional probability using the ML kernel's 252-day Normalized RSI (Z-Score) and Relative Volume (RVOL). The prediction box dynamically adjusts its range based on this probability to provide immediate visual feedback on high-probability direction.
Bullish Scenario (ml_prob > 1.0):
• Upper Range: Expands significantly (1.5x multiplier) to show the aggressive upside target
• Lower Range: Tightens (0.5x multiplier) to show the invalidation level
• Visual Intent: The box is visibly skewed upward, immediately communicating bullish bias without requiring numerical analysis.
Bearish Scenario (ml_prob < -1.0):
• Upper Range: Tightens (0.5x multiplier) to show the invalidation level
• Lower Range: Expands significantly (1.5x multiplier) to show the aggressive downside target
• Visual Intent: The box is visibly skewed downward, immediately communicating bearish bias.
Neutral Scenario (-1.0 < ml_prob < 1.0):
Both ranges use balanced multipliers, creating a symmetrical box that indicates uncertainty.
B. DYNAMIC VOLATILITY BOOSTER (SESSION-BASED ADAPTATION)
The prediction box adjusts its volatility multiplier based on the current session and market conditions to account for intraday volatility patterns.
AM Session (Morning: 07:00-12:00):
• Base Multiplier: 1.0x (Neutral Base)
• Logic: Morning sessions often contain false breakouts and noise. The base multiplier starts neutral to avoid over-projecting during consolidation.
• Trend Booster: Multiplier jumps to 1.5x when:
Price > London Session Open AND AI is Bullish (ml_prob > 0), OR
Price < London Session Open AND AI is Bearish (ml_prob < 0)
• Logic: When the London trend (typically 03:00-08:00 NY time) aligns with the AI model's directional conviction, the indicator aggressively targets higher volatility expansion. This filters for "institutional follow-through" rather than random morning chop.
PM Session (Afternoon: 13:00-16:00):
• Fixed Multiplier: 1.8x
• Logic: The PM session, particularly the 13:30-16:00 ICT Silver Bullet window, often contains the "True Move" of the day. A higher baseline multiplier is applied to emphasize this session's significance over morning noise.
Safety Floor:
A minimum range of 0.2% of the current price is enforced regardless of volatility conditions.
• Purpose: Maintains the prediction box visibility during extreme low-volatility consolidation periods where ATR might collapse to near-zero values.
Volatility Clamp Protection:
Maximum volatility is capped at three times the current ATR value. During flash crashes, circuit breaker halts, or large overnight gaps, raw volatility calculations can spike to extreme levels. This clamp prevents prediction boxes from expanding to unrealistic widths.
Technical Implementation:
f_get_ai_multipliers(float _prob) =>
float _abs_prob = math.abs(_prob)
float _range_mult = 1.0
float _dur_mult = 1.0
if _abs_prob > 30
_range_mult := 1.8
else if _abs_prob > 10
_range_mult := 1.2
else
_range_mult := 0.7
C. PRACTICAL INTERPRETATION
• Wide Upper Range + Tight Lower Range: Strong bullish conviction. The model expects significant upside with limited downside risk.
• Tight Upper Range + Wide Lower Range: Strong bearish conviction. The model expects significant downside with limited upside.
• Symmetrical Range: Neutral/uncertain market. Wait for directional confirmation before entry.
• Large Box (Extended Duration): High-confidence prediction expecting sustained movement.
• Small Box (Short Duration): Low-confidence or choppy conditions. Expect quick resolution.
III. PRACTICAL USAGE GUIDE: METHODOLOGY AND EXECUTION
A. ESTABLISHING TRADING CONTEXT (THE THREE CHECKS)
The primary goal of the dashboard is to filter out low-probability trade setups before they occur.
• Timeframe Selection: Although the core AI is normalized to the Daily context, the indicator performs optimally on intraday timeframes (e.g., 5m, 15m) where session-based volatility is most pronounced.
• PHASE Check (Timing): Always confirm the current phase. The highest probability signals typically occur within the visually highlighted NY AM/PM Killzones because this is when institutional liquidity and volume are at their peak. Signals outside these zones should be treated with skepticism.
• MARKET REGIME Check (Bias): Ensure the signal (BUY/SELL arrow) aligns with the established MARKET REGIME bias (BULLISH/BEARISH). Counter-bias signals are technically allowed if the score is high, but they represent a higher risk trade.
• VIX REGIME Check (Risk): Review the VIX REGIME for overall market stress. Periods marked DANGER (high VIX) indicate elevated volatility and market uncertainty. During DANGER regimes, reducing position size or choosing a wider SL Multiplier is advisable.
B. DASHBOARD INTERPRETATION (THE REAL-TIME STATUS DISPLAY)
The indicator features a non-intrusive dashboard that provides real-time, context-aware information based on the core analytical engines.
PHASE: (PRE-MARKET, NY-AM, LUNCH, NY-PM)
• Meaning: Indicates the current institutional session time. This is derived from the customizable session inputs.
• Interpretation: Signals generated during NY-AM or NY-PM (Killzones) are generally considered higher-probability due to increased institutional participation and liquidity.
MARKET REGIME: (BULLISH, BEARISH, NEUTRAL)
• Meaning: The established directional bias for the trading day, confirmed by the price breaking above the Pre-Market High (PMH) or below the Pre-Market Low (PML).
• Interpretation: Trading with the established regime (e.g., taking a BUY signal when the regime is BULLISH) is the primary method. NEUTRAL indicates that the PMH/PML boundary has not yet been broken, suggesting market ambiguity.
VIX REGIME: (STABLE, DANGER)
• Meaning: A measure of overall market stress and stability, based on the CBOE VIX index integration. The thresholds (20.0 and 35.0 default) are customizable by the user.
• Interpretation: STABLE indicates stable volatility, favoring momentum trades. DANGER (VIX > 35.0) indicates extreme stress; signals generated in this environment require caution and often necessitate smaller position sizing.
SIGNAL SCORE: (0 to 10+ Points)
• Meaning: The accumulated score derived from the VOLATILITY NORMALIZED AI SCORING ENGINE, factoring in bias, VWAP alignment, volume, and the Z-Score probability.
• Interpretation: The indicator generates a signal when this score meets or exceeds the Minimum Entry Score (default 3). A higher score (e.g., 7+) indicates greater statistical confluence and a stronger potential entry.
AI PROBABILITY: (Bull/Bear %)
• Meaning: Directional probability derived from the ML kernel, expressed as a percentage with Bull/Bear label.
• Interpretation: Higher absolute values (>20%) indicate stronger directional conviction from the ML model.
LIVE METRICS SECTION:
• STATUS: Shows current trade state (LONG, SHORT, or INACTIVE)
• ENTRY: Displays the entry price for active trades
• TARGET: Shows the calculated Take Profit level
• ROI | KILL ZONE:
◦ For Active Trades: Displays real-time P&L percentage during NY session hours.
◦ At Market Close (16:00 NY): Since this is a NY session-specific indicator, any active position is automatically evaluated and closed at 16:00. The final result (VALIDATED or INVALIDATED) is determined based on whether the trade reached profit or loss at market close.
◦ Result Persistence: The killzone result (VALIDATED/INVALIDATED) remains displayed on the dashboard until the next NY AM KILLZONE session begins, providing a clear performance reference for the previous trading day.
Note: If a trade is still trending at 16:00, it will be force-closed and evaluated at that moment, as the indicator operates strictly within NY trading hours.
C. SIGNAL GENERATION AND ENTRY LOGIC
The indicator generates signals based on two distinct technical setups, both of which require the accumulated SIGNAL SCORE to be above the configured Minimum Entry Score.
Breakout Entry
• Trigger Condition: Price closes beyond the Pre-Market High (PMH) or Low (PML).
• Rationale: This setup targets the initial directional movement for the day. A breakout confirms the institutional bias by decisively breaking the first major structural boundary, making the signal high-probability.
Continuation Entry
• Trigger Condition: The market is already in an established regime (e.g., BULLISH), and the price closes above the high (or below the low) of the previous bar, while the SIGNAL SCORE remains high. Requires the Allow Trend Continuation parameter to be active.
• Rationale: This setup targets follow-through trades, typically in the afternoon session, capturing momentum after the morning's direction has been confirmed. This filters for sustainability in the established trend.
Execution: Execute the trade immediately upon the close of the bar that prints the BUY or SELL signal arrow.
D. MANAGING RISK AND EXITS
1. RISK PARAMETER SELECTION
The indicator immediately draws the dynamic TP/SL zones upon entry.
• Volatility-Based (Recommended Default): By setting the SL Multiplier (e.g., 1.5) and the TP Multiplier (e.g., 3.0), the indicator enforces a constant, dynamically sized risk-to-reward ratio (e.g., 1:2 in this example). This helps that risk management scales proportionally with the current market volatility (ATR).
• Structural Override: Selecting the Use Structural SL parameter fixes the stop-loss not to the ATR calculation, but to the more significant structural level of the PMH or PML. This is utilized by traders who favor institutional entry rules where the stop is placed behind the liquidity boundary.
2. EXIT METHODS
• Hard Exit: Price hits the visual TP or SL box boundary.
• Soft Exit (Momentum Decay Filter): If the trade is active and the SIGNAL SCORE drops below the Exit Score Threshold (default 3), it indicates that the momentum supporting the trade has significantly collapsed. This serves as a momentum decay filter, prompting the user to consider a manual early exit even if the SL/TP levels have not been hit, thereby preserving capital during low-momentum consolidation.
• Market Close Auto-Exit: At 16:00 NY time, any active trade is automatically closed and classified as VALIDATED (profit) or INVALIDATED (loss) based on current price vs. entry price.
IV. PARAMETER REFERENCE AND CONFIGURATION
A. GLOBAL SETTINGS
• Language (String, Default: English): Selects the language for the dashboard and notification text. Options: English, Korean, Chinese, Spanish, Portuguese, Russian, Ukrainian, Vietnamese.
B. SESSION TIMES (3 BOX SYSTEM)
• PRE-MARKET (Session, Default: 0800-0930): Defines the session range used for Pre-Market High/Low (PMH/PML) structural calculation.
• REGULAR (Morning) (Session, Default: 0930-1200): Defines the core Morning trading session.
• AFTERNOON (PM) (Session, Default: 1300-1600): Defines the main Afternoon trading session.
• Timezone (String, Default: America/New_York): Sets the timezone for all session and time-based calculations.
C. NY KILLZONES (OVERLAYS)
• Show NY Killzones (Bool, Default: True): Toggles the translucent background fills that highlight high-probability trading times (Killzones).
• NY AM Killzone (Session, Default: 0700-1000): Defines the specific time window for the first key liquidity surge (Open overlap).
• NY PM Killzone (Session, Default: 1330-1600): Defines the afternoon liquidity window, aligned with the ICT Silver Bullet and PM Trend entry timing.
• Allow Entry in Killzones (Bool, Default: True): Enables or disables signal generation specifically during the defined Killzone hours.
• Activate AI Prediction Box (Bool, Default: True): Toggles the drawing of the predicted target range boxes on the chart.
D. CORE SCORING ENGINE
• Minimum Entry Score (Int, Default: 3): The lowest accumulated score required for a Buy/Sell signal to be generated and plotted.
• Allow Trend Continuation (Bool, Default: True): Enables the secondary entry logic that fires signals based on momentum in an established trend.
• Force Ignore Volume (Bool, Default: False): Overrides the volume checks in the scoring engine. Useful for markets where volume data is unreliable or nonexistent.
• Force Show Signals (Ignore Score) (Bool, Default: False): Debug mode that displays all signals regardless of score threshold.
• Integrate CBOE:VIX (Bool, Default: True): Enables the connection to the VIX index for market stress assessment.
• Stable VIX (<) (Float, Default: 20.0): VIX level below which market stress is considered low (increases score).
• Stress VIX (>) (Float, Default: 35.0): VIX level above which market stress is considered high (decreases score/flags DANGER).
• Use ML Probability (Bool, Default: True): Activates the volatility-normalized AI Z-Score kernel. Disabling this removes the cross-timeframe normalization filter.
• Max Learning History (Int, Default: 2000): Maximum number of bars stored in the ML training arrays.
• Normalization Lookback (252 Days) (Int, Default: 252): The number of DAILY bars used to calculate the Z-Score mean and standard deviation (representing approximately 1 year of data).
E. RISK MANAGEMENT (ATR MODEL)
• Use Structural SL (Bool, Default: False): Overrides the ATR-based Stop Loss distance to use the Pre-Market High/Low as the fixed stop level.
• Stop Loss Multiplier (x ATR) (Float, Default: 1.5): Defines the Stop Loss distance in multiples of the current Average True Range (ATR).
• Take Profit Multiplier (x ATR) (Float, Default: 3.0): Defines the Take Profit distance in multiples of the current Average True Range (ATR).
• Exit Score Threshold (<) (Int, Default: 3): The minimum score below which an active trade is flagged for a Soft Exit due to momentum collapse.
F. VISUAL SETTINGS
• Show Dashboard (Bool, Default: True): Toggles the real-time data panel.
• Show NY Killzones (Bool, Default: True): Toggles killzone background fills.
• Show TP/SL Zones (Bool, Default: True): Toggles the drawing of Take Profit and Stop Loss boxes.
• Show Pre-Market Extensions (Bool, Default: True): Extends PM High/Low lines across the entire chart for support/resistance reference.
• Activate AI Prediction Box (Bool, Default: True): Enable or disable the predictive range projection.
• Light Mode Optimization (Bool, Default: True): Toggles dashboard and plot colors for optimal visibility on white (light) chart backgrounds.
• Enforce Trend Coloring (Bool, Default: True): Forces candle colors based on Market Regime (Bullish=Cyan, Bearish=Pink) to emphasize trend direction.
• Label Size (String, Default: Normal): Options: Tiny, Small, Normal.
G. LIQUIDITY POOLS (PDH/PDL)
• Show Liquidity Lines (Bool, Default: True): Toggles the display of the Previous Day High (PDH) and Low (PDL) lines.
• Liquidity High Color (Color, Default: Green): Color setting for the PDH line.
• Liquidity Low Color (Color, Default: Red): Color setting for the PDL line.
🔔 ALERT CONFIGURATION GUIDE
The indicator is equipped with specific alert conditions.
How to Set Up an Alert:
Click the "Alert" (Clock icon) in the top TradingView toolbar.
Select "Market Regime NY Session " from the Condition dropdown menu.
Choose one of the specific trigger conditions below depending on your strategy:
🚀 Available Alert Conditions
1. BUY (Long Entry)
Trigger: Fires immediately when a confirmed Bullish Setup is detected.
Conditions: Market Bias is Bullish (or valid Continuation) + Signal Score ≥ Minimum Entry Score.
Usage: Use this alert to open new Long positions or close existing Short positions.
2. SELL (Short Entry)
Trigger: Fires immediately when a confirmed Bearish Setup is detected.
Conditions: Market Bias is Bearish (or valid Continuation) + Signal Score ≥ Minimum Entry Score.
Usage: Use this alert to open new Short positions or close existing Long positions.
V. IMPORTANT TECHNICAL LIMITATIONS
⚠️ Intraday Only (Timeframe Compatibility)
This indicator is strictly designed for Intraday Timeframes (1m to 4h).
Daily/Weekly Charts: The session logic (e.g., "09:30-16:00") cannot function on Daily bars because a single bar encompasses the entire session. Session boxes, TP/SL zones, and AI prediction boxes will NOT draw on the Daily timeframe. Only the PDH/PDL liquidity lines remain visible on Daily charts. This is expected behavior, not a limitation.
Maximum Supported Timeframe: All visual components (session boxes, killzone overlays, TP/SL zones, AI prediction boxes) are displayed up to the 4-hour timeframe. Above this timeframe, only PDH/PDL lines and the dashboard remain functional.
⚠️ Drawing Object Limit (Max 500)
A single script can display a maximum of 500 drawing objects (boxes/lines) simultaneously.
On lower timeframes (e.g., 1-minute), where many signals and session boxes are generated, older history (typically beyond 10-14 days) will automatically disappear to make room for new real-time data.
For deeper historical backtesting visualization, switch to higher timeframes (e.g., 15m, 1h).
The indicator implements FIFO array management to comply with this limit while maintaining the most recent and relevant visual data.
VI. PRACTICAL TRADING TIPS AND BEST PRACTICES
• Killzone Confirmation: The highest statistical validity is observed when a high-score signal occurs directly within a visible NY AM/PM Killzone. Use the Killzones as a strict time filter.
• Liquidity Awareness (PDH/PDL): Treat the Previous Day High (PDH) and Low (PDL) lines as magnets. If your dynamic Take Profit (TP) is placed just above PDH, consider adjusting your target slightly below PDH or utilizing the Soft Exit, as liquidity absorption at these levels often results in sudden, sharp reversals that stop out a trade just before the target is reached.
• VIX as a Position Sizer: During DANGER VIX regimes, the resulting high volatility means the ATR value will be large. It is prudent to either reduce the SL Multiplier or, more commonly, reduce the overall position size to maintain a constant currency risk exposure per trade.
• Continuation Filter Timing: Trend Continuation signals are most effective during the Afternoon (PM) session when the morning's directional breakout has had time to establish a strong, clear, and sustainable trend. Avoid using them in the initial AM session when the direction is still being contested.
• 16:00 Market Close Rule: All trades, boxes, and lines are automatically cleaned up at 16:00 NY time. This prevents overnight chart clutter and maintains visual clarity.
VII. DISCLAIMER & RISK WARNINGS
• Educational Purpose Only
This indicator, including all associated code, documentation, and visual outputs, is provided strictly for educational and informational purposes. It does not constitute financial advice, investment recommendations, or a solicitation to buy or sell any financial instruments.
• No Guarantee of Performance
Past performance is not indicative of future results. All metrics displayed on the dashboard (including "ROI" and trade results) are theoretical calculations based on historical data. These figures do not account for real-world trading factors such as slippage, liquidity gaps, spread costs, or broker commissions.
• High-Risk Warning
Trading cryptocurrencies, futures, and leveraged financial products involves a substantial risk of loss. The use of leverage can amplify both gains and losses. Users acknowledge that they are solely responsible for their trading decisions and should conduct independent due diligence before executing any trades.
• Software Limitations
The software is provided "as is" without warranty. Users should be aware that market data feeds on analysis platforms may experience latency or outages, which can affect signal generation accuracy.

Day Trading Signals Trend & Momentum Buy/Sell [CocoChoco]Day Trading Signals: Trend & Momentum Buy/Sell
Overview
The indicator is a comprehensive day-trading tool designed to identify high-probability entries by aligning short-term momentum with long-term trend confluence.
It filters out low-volatility "choppy" markets using ADX and ensures you are always trading in the direction of the dominant higher-timeframe trend.
Important: Use on timeframes from 15 min to 2 hours, as the indicator is for day trading only.
How It Works
The script uses a three-layer confirmation system:
Trend Alignment: Uses a Fast/Slow SMA cross (10/50) on the current chart. Signal prints only if price closes above (for bullish) or below (for bearish) the 10-period SMA.
Higher Timeframe Confluence: The script automatically looks at a higher timeframe (1H for charts <=15m, and 4H for others) and checks if the price is above/below a 200-period SMA.
Momentum & Volatility: Signals are only triggered if the Stochastic Oscillator is rising/falling and the ADX is above 20, ensuring there is enough "strength" behind the move.
Visual Signals Buy/Sell
Green Label (Up Arrow): Bullish entry signal
Red Label (Down Arrow): Bearish entry signal.
Red "X": Exit signal based on a moving average crossover (trend exhaustion).
Visual Risk/Reward (1:1) Boxes: When a signal appears, the script automatically draws a projection of your Stop Loss (Red) and Take Profit (Green) based on the current ATR (Average True Range).
How to Use
Entry: Enter when a Label appears. Ensure the candle has closed to confirm the signal.
Stop Loss/Take Profit: Use the visual boxes as a guide. The default is 1.0 ATR for risk and 1.0 RR ratio, which can be adjusted in the settings.
Exit: Exit the trade either at the target boxes or when the Red "X" appears, indicating the trend has shifted.
Please note that this is just a tool, not financial advice. Perform your own analysis before entering a trade.

The BLUE Red Candle Swing w AlertsThe script is for high probability swing entries based on a extremely strong bearish candles which typically come right before a green push up.
When a bearish candle has a higher than average ATR, it is a sign that there could be a large reversal coming next.
Use this indicator to help you set the stop loss and take profit based on the range of the highlighted Red candle.
*So if the ATR of this candle is $3.00 then set a $3.00 stop loss and take profit.
There is also a sc
Rules for the ATR RED/Blue Impulse candle
*Use the 50% line or midline of the candle to help refine your entries
*Use the range of the Blue candle as your stop loss range and for your 1st take profit target!
*Add more positions if there is a clear trend after the candle

SMA Strategy [MK]Overview
This strategy is a momentum-based trend-following system designed to capture sustained market moves while minimizing "whipsaws" often found in sideways markets. It utilizes a dual-SMA filter for trend direction, a precise price-crossover trigger for entry, and the Average Directional Index (ADX) to gauge market strength.
How It Works
The strategy follows a strict "Trend + Momentum + Strength" hierarchy:
1. Trend Identification (The Filter) The script uses a Fast SMA (20) and a Slow SMA (50).
Long Bias: SMA-20 > SMA-50.
Short Bias: SMA-20 < SMA-50.
2. Precise Entry (The Trigger) Unlike strategies that enter simply because the price is above a line, this script requires a Price Crossover.
Long Entry: Price must actively cross from below to above the SMA-20.
Short Entry: Price must actively cross from above to below the SMA-20.
3. Trend Strength (The ADX Gatekeeper) To solve the problem of sideways markets where moving averages run parallel, we’ve integrated the ADX (Average Directional Index). The strategy will only trigger a trade if the ADX is above a user-defined threshold (default is 25), ensuring we only enter when the market is trending.
4. RSI Safety Filter To prevent "buying the top" or "selling the bottom," the RSI checks for overextended conditions. It prevents long entries if the RSI is already overbought and short entries if it is oversold.
Exit Logic
The strategy features three layers of protection:
Trend Reversal Exit: Closes the position if the price crosses back over the SMA-20 while the macro trend (SMA-20/SMA-50) has flipped.
Fixed Take Profit: A percentage-based target to lock in gains during sharp moves.
Fixed Stop Loss: A percentage-based safety net to protect capital.
Key Features
Directional Selector: Choose between "Long Only," "Short Only," or "Both."
Visual Feedback: Background colors highlight "Trending" (Green) vs "Sideways" (Red) market regimes.
Fully Customizable: All lengths and thresholds for SMAs, RSI, and ADX can be adjusted to fit different assets and timeframes.
Instructions for Use
Timeframe: This strategy is optimized for trending timeframes such as the 1-Hour (1H), 4-Hour (4H), or Daily (D). Using it on very low timeframes (1-minute or 5-minute) may increase the number of false signals due to market noise.
Asset Classes: Best suited for high-volume assets like Major Forex Pairs, Large-Cap Stocks, and Blue-Chip Cryptocurrencies.
Parameter Tuning: Use the "Strategy Tester" to find the ideal ADX Threshold for your specific asset. Volatile assets usually require a higher ADX (30+) to filter out fake breakouts.
Disclaimer
Financial Risk Warning: The script provided is for educational and informational purposes only. Trading involves significant risk, and there is always the potential for loss. Past performance, whether simulated or real, is not a guarantee of future results.
The author of this script is not a financial advisor. This indicator is not a signal service or a recommendation to buy or sell any security. Always perform your own due diligence and test any strategy thoroughly on a demo account before risking live capital. By using this script, you acknowledge that you are solely responsible for your trading decisions and any resulting financial outcomes.

Nexus Momentum Flow [JOAT]
Nexus Momentum Flow - ADX-Based Trend Strength Analysis
Introduction and Purpose
Nexus Momentum Flow is an open-source oscillator indicator that combines the ADX (Average Directional Index) with directional movement indicators (+DI/-DI) to create a comprehensive trend strength and direction analysis tool. The core problem this indicator solves is that ADX alone tells you trend strength but not direction, while +DI/-DI alone tells you direction but not strength. Traders need both pieces of information together.
This indicator addresses that by combining ADX strength classification with directional bias into a single confluence score, making it easy to identify when strong trends exist and which direction they favor.
Why These Components Work Together
1. ADX (Average Directional Index) - Measures trend strength regardless of direction. Values above 25 indicate trending; below 20 indicate ranging.
2. +DI (Positive Directional Indicator) - Measures upward price movement strength.
3. -DI (Negative Directional Indicator) - Measures downward price movement strength.
4. Confluence Score - Combines ADX strength with DI bias to create a single actionable metric.
The combination works because:
ADX filters out ranging markets where DI crossovers produce whipsaws
DI relationship provides direction when ADX confirms trend
Confluence score simplifies the analysis into one number
How the Calculation Works
float directionBias = diPlus - diMinus
float confluenceScore = (adx / 100) * directionBias
The confluence score is positive when +DI > -DI (bullish) and negative when -DI > +DI (bearish), with magnitude scaled by ADX strength.
Trend State Classification
EXTREME - ADX > 50 (very strong trend)
STRONG - ADX 35-50 (strong trend)
TRENDING - ADX 25-35 (moderate trend)
RANGING - ADX < 25 (no clear trend)
Dashboard Information
Status - Current trend state (EXTREME/STRONG/TRENDING/RANGING)
Direction - BULLISH or BEARISH based on DI relationship
ADX - Current ADX value
DI Bias - Difference between +DI and -DI
Confluence - Combined score with directional context
How to Use This Indicator
For Trend Following:
1. Wait for ADX to show TRENDING or higher
2. Check direction matches your trade bias
3. Enter on pullbacks when confluence remains positive/negative
4. Exit when ADX drops to RANGING
For Avoiding Whipsaws:
1. Do not trade DI crossovers when ADX shows RANGING
2. Only trust directional signals when ADX confirms trend
3. Use RANGING periods for mean-reversion strategies instead
For Trend Exhaustion:
1. Watch for EXTREME ADX readings
2. Extreme trends often precede reversals
3. Consider taking profits when ADX reaches extreme levels
Input Parameters
ADX Length (14) - Period for ADX calculation
DI Length (14) - Period for directional indicators
ADX Smoothing (14) - Smoothing period for ADX
Trend Threshold (25) - ADX level for trend confirmation
Strong Threshold (35) - ADX level for strong trend
Extreme Threshold (50) - ADX level for extreme trend
Timeframe Recommendations
Daily/4H: Best for swing trading trend analysis
1H: Good for intraday trend following
15m: More signals but requires faster reaction
Limitations
ADX is a lagging indicator - trends are confirmed after they start
DI crossovers can whipsaw even with ADX filter
Works best in markets that trend clearly
May miss early trend entries due to confirmation requirement
Open-Source and Disclaimer
This script is published as open-source under the Mozilla Public License 2.0 for educational purposes.
This indicator does not constitute financial advice. Trend analysis does not guarantee profitable trades. Always use proper risk management.
- Made with passion by officialjackofalltrades

RSI Apex: Breakout & DivergenceRSI Apex: Breakout & Divergence System
RSI Apex:突破与背离交易系统
🇬🇧 English Description
RSI Apex is a comprehensive trading system designed to capture both Trend Breakouts and Market Reversals. Unlike traditional RSI indicators that rely solely on fixed levels (70/30), RSI Apex integrates Donchian Channels, Volatility Squeeze, and the Libertus Divergence Algorithm to provide high-probability signals.
🚀 Key Features
Trend Push System (Donchian Breakout):
Detects when RSI momentum is strong enough to push the upper/lower Donchian Channel bands.
Signal: Displays ▲ (Bull) or ▼ (Bear) at levels 20/80.
Libertus Divergence (No-Lag):
Uses a real-time pivot tracking algorithm to identify divergences between Price and RSI without the lag of traditional pivot points.
Signal: Displays "Div" labels at levels 30/70.
Smart Coloring (Extreme Highlight):
Green/Red: Normal Trend.
White (Extreme): When RSI breaches 70 (Overbought) or 30 (Oversold), the line turns bright White. This highlights the most volatile zones where reversals or strong continuations occur.
Volatility Squeeze Filter:
Monitors market volatility. When the Donchian Channel compresses significantly (below historical average), the background turns Purple.
Meaning: "Calm before the storm"—expect a major move soon.
🛠 How to Use
Trend Following: Enter when you see Green/Red RSI lines accompanied by ▲ / ▼ signals. This indicates a "Trend Push."
Reversal Trading: Look for "Div" signals when the RSI line is White (Extreme). This suggests momentum is fading despite price action.
Exit/Take Profit: Watch for the "Weak" label, which appears when RSI falls back into the neutral zone.
Dashboard: Monitor real-time RSI Value, Market State (Bullish/Bearish/Extreme), and Volatility (Squeeze/Expanding) in the bottom-right table.
🇨🇳 中文简介
RSI Apex 是一套旨在捕捉趋势爆发 (Breakout) 和 市场反转 (Reversal) 的综合交易系统。与仅依赖固定 70/30 线的传统 RSI 不同,本指标融合了 唐奇安通道 (Donchian Channels)、波动率挤压 (Squeeze) 以及 Libertus 无滞后背离算法,以提供高胜率的交易信号。
🚀 核心功能
强趋势推动系统 (唐奇安突破):
检测 RSI 动能是否强劲到足以推动唐奇安通道的上轨或下轨扩张。
信号: 在 20/80 轴位置显示 ▲ (多头推动) 或 ▼ (空头推动)。
Libertus 智能背离 (无滞后):
采用实时 Pivot 追踪算法,精准识别价格与 RSI 之间的背离,解决了传统背离指标的滞后问题。
信号: 在 30/70 轴位置显示 "Div" 标签。
智能变色 (极端行情高亮):
绿色/红色: 正常趋势状态。
白色 (White): 极端区域。当 RSI 突破 70 (超买) 或跌破 30 (超卖) 时,线条会强制变为醒目的亮白色,提示此处为变盘/背离高发区。
波动率挤压 (Squeeze) 过滤器:
实时监控市场波动率。当通道宽度显著收窄(低于历史平均水平)时,背景会填充为半透明紫色。
含义: “暴风雨前的宁静”——预示着大行情即将爆发,此时应空仓等待突破方向。
🛠 使用策略
顺势交易 (Trend): 当 RSI 呈现 绿色/红色 并伴随 ▲ / ▼ 信号时进场。这代表动能极强,处于主升/主跌浪。
左侧反转 (Reversal): 重点关注 RSI 线条变为 白色 (Extreme) 时出现的 "Div" 背离信号。这通常意味着价格虽创新高,但动能已耗尽。
止盈/离场: 留意 "Weak" (衰竭) 标签,它出现在 RSI 掉回中间震荡区时。
仪表盘: 右下角面板实时显示 RSI 数值、市场状态 (极值/背离/趋势) 以及波动率状态 (挤压/扩张)。

ATR Trailing Stop + HTF + Pivots (Non-Repainting📌 UT Bot PRO + HTF + Pivots + PP SuperTrend (Non-Repainting)
This indicator is a fully non-repainting trading system designed for intraday and swing traders.
It combines multiple high-probability confirmations into a single, clean signal engine.
🔍 What’s Inside
✔ ATR-based trailing stop (UT-Bot style logic)
✔ Heikin Ashi price smoothing
✔ Heikin Ashi VWAP trend confirmation
✔ Higher-Timeframe EMA filter (no lookahead)
✔ Volume strength confirmation
✔ Auto timeframe Standard Pivot Points (PP, R1, R2, S1, S2)
✔ Pivot Point SuperTrend for market direction
✔ ATR-based Stop Loss & Take Profit levels
🔒 Non-Repainting Guarantee
Signals trigger only on confirmed candle close
Higher timeframe data uses lookahead_off
Pivot calculations are confirmed (no future data)
Signals will not disappear or shift after printing
📈 Trading Logic
BUY Signal
Price crosses above ATR trailing stop
Pivot SuperTrend is bullish
Price above HA VWAP
HTF EMA trend is bullish
Volume above average
SELL Signal
Price crosses below ATR trailing stop
Pivot SuperTrend is bearish
Price below HA VWAP
HTF EMA trend is bearish
Volume above average
⚙️ Recommended Settings
Intraday (5m–15m): HTF = 15m
Scalping (1m–5m): HTF = 5m
Swing (15m–1H): HTF = 1H
SL: 1.5 × ATR
TP: 3 × ATR
🧠 Best Used For
Crypto
Forex
Indices
Stocks
Works best in trending markets. Avoid very low-volume or choppy sessions.
⚠️ Disclaimer
This indicator is for educational purposes only.
No trading strategy guarantees profits. Always use proper risk management and test before live trading.
